Overview
In order to access the Rule Engine dashboard you need to click on the  icon located on the top section of the RM Console.
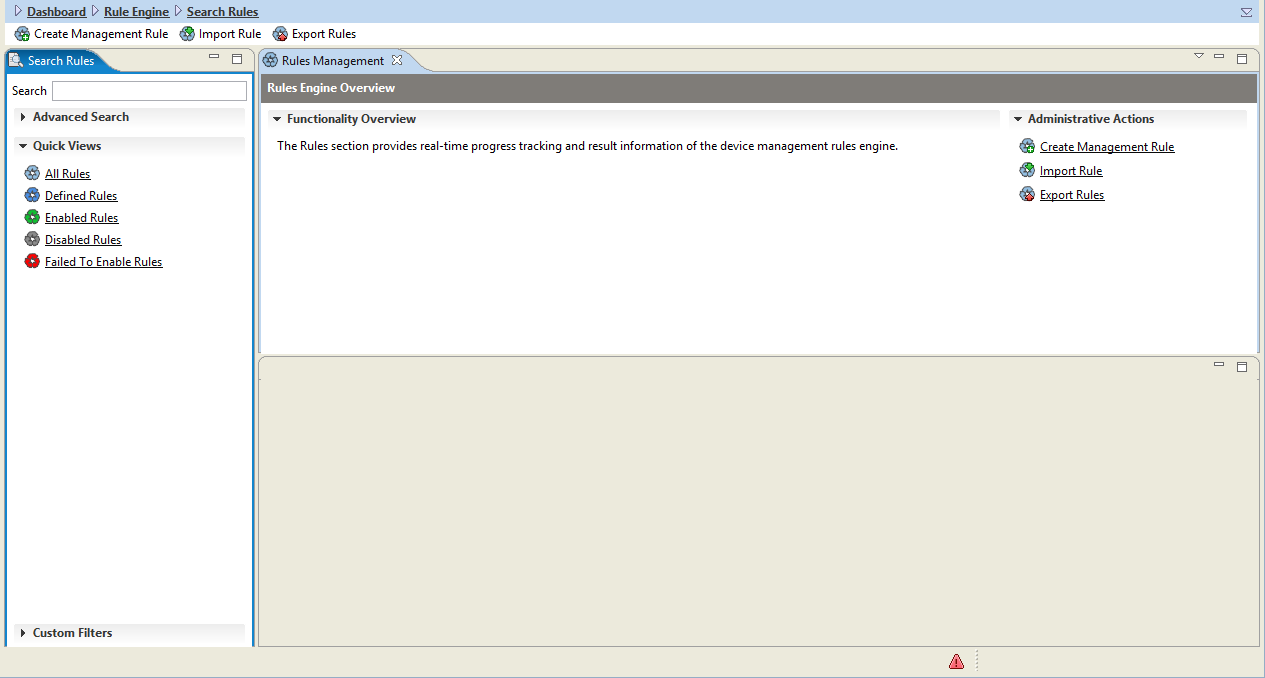
The Rules dashboard view has two main areas - the left one (Search) allows you to specify the type of Rules that you want to see in the right one. The right area is for Rules management (e.g. lists the Rules matching the criteria from the Search pane and underneath, in the Operation Details pane, visualizes the properties of the operation selected from the list).
The Search part of the Rules dashboard view contains several expandable sections for filtering displayed information. The Quick Views section contains ready-to-use shortcuts for listing operations by their status. The Advanced Search one allows you to define a complex set of criteria to apply on shown Rules. And Custom Filters contains shortcuts to filters you have created in Advanced Search and saved for further use.
Initially, there are no Rules shown:
Creating a Rule
Create Rule Wizard
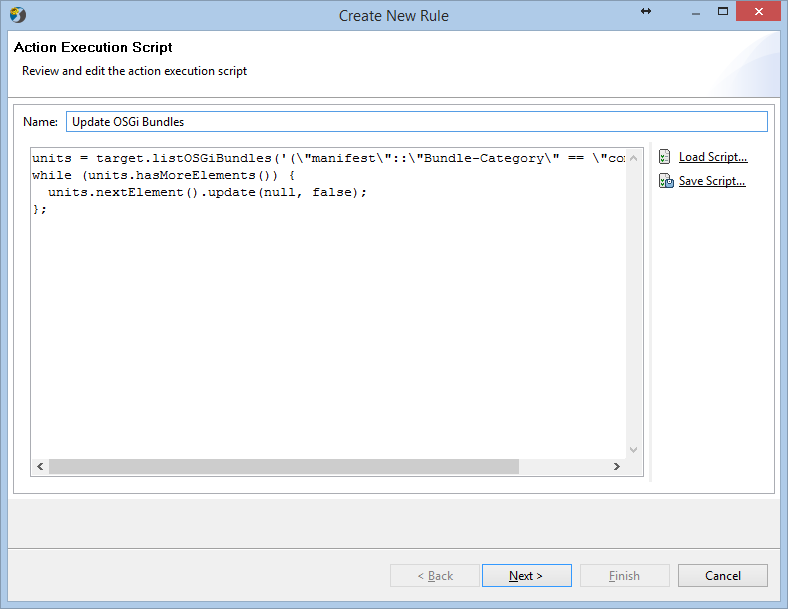
Creating management Rules allows you to define your own Rules by writing or loading your own Groovy Scripts. To start creating your Rule, click on Create Management Rule button. The Create Rule wizard will appear:
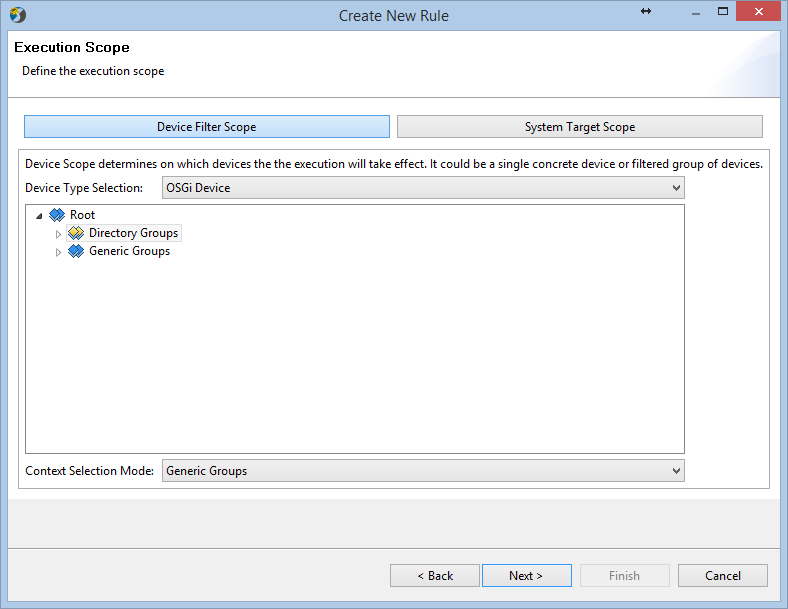
On the next screen you must select the appropriate Scope (Device/System) and also the appropriate device or group of devices on which to apply the Rule (see also "Task Scope" section from Task Execution conceptual guide).
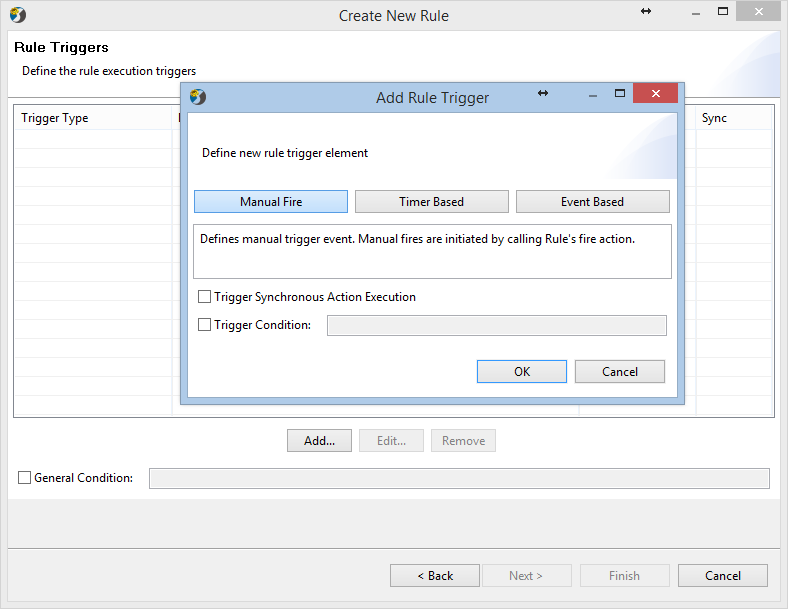
Next step is to select appropriate Trigger type for the Rule (see the Rule Trigger subsection from Rule-Based Automation conceptual guide) . There are three trigger type options:
Manual Fire – Defines manual trigger event. Manual fires are initiated by calling Rule's fire action.
Timer Based – Defines timer trigger event. Timer fires are initiated on particular time schedule. You must choose the time schedule for the trigger.
Event Based – Defines event trigger event. Event fires are initiated on notifications by functional events. You must select the Event Type that will be the trigger.
Additionally you can choose Synchronous Execution and define Trigger Condition.
Selecting Trigger Condition checkbox allows you to write/import additional Groovy condition.
Manual Trigger allows you to fire manually the Rule by clicking on "Fire Rule":
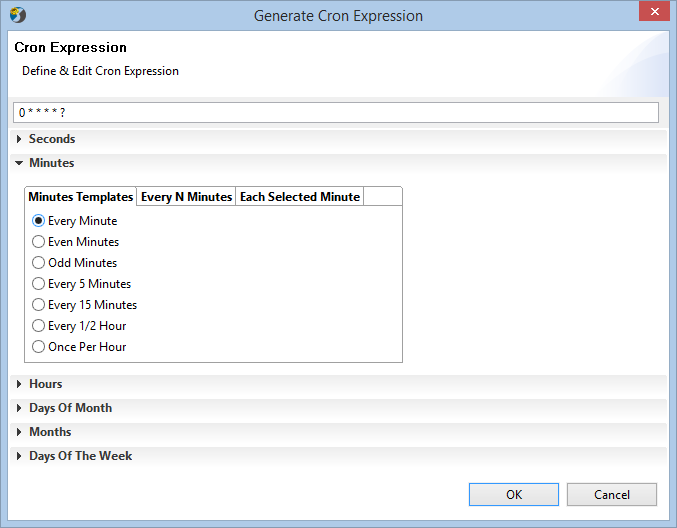
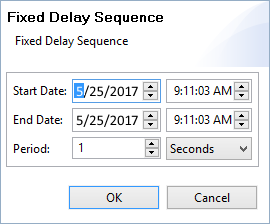
Timer Based triggers allow you to schedule when the Rule should be fired. You can choose between Cron Expression  (e.g. once every month) and Fixed Delay Sequence
 (e.g. the Rule will be fired every 1 minute with a fixed delay, meaning that the period will be measured from the completion time of each preceding Rule fire).
Timer Based Fire Trigger:
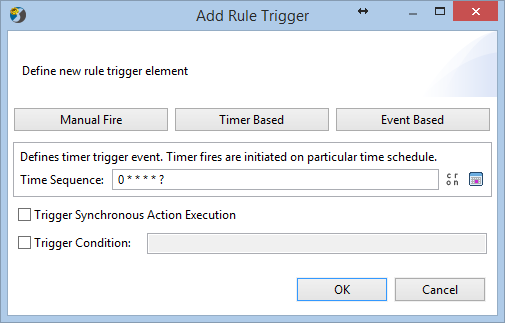
Cron Expression and Fixed Delay Sequence Timers.
Event Based triggers allow easy set up of trigger conditions based on the event information.
Click on the Browse Events button and select the trigger event that will activate the Rule.
Event Based trigger allows you to specify on which event the Rule must be automatically triggered by the System.
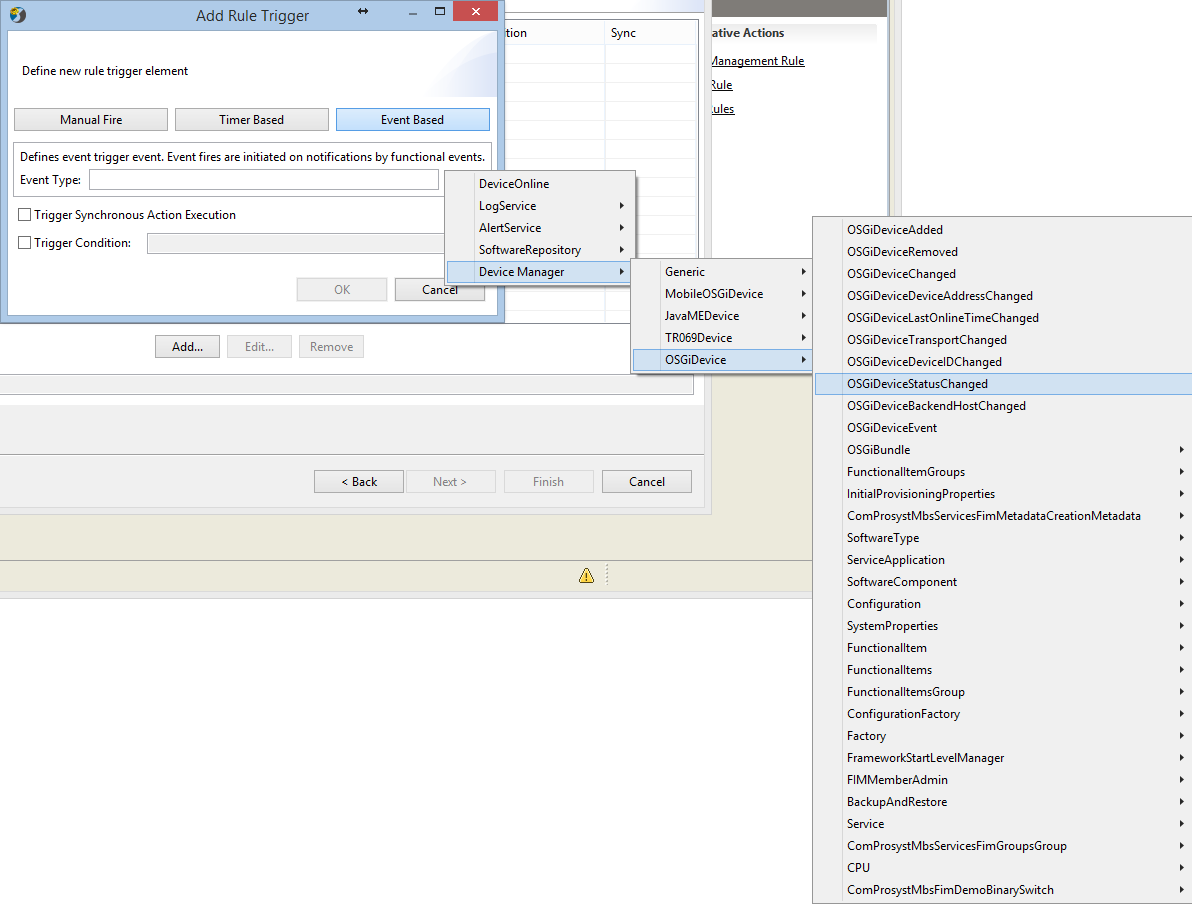
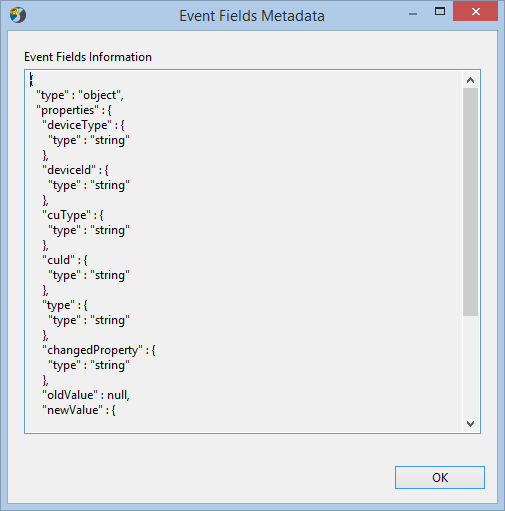
After selecting the event trigger the button Event Fields Metadata – , becomes available and enables you to open a tree view structure of the available events dedicated for Rule triggers (see the figure below):
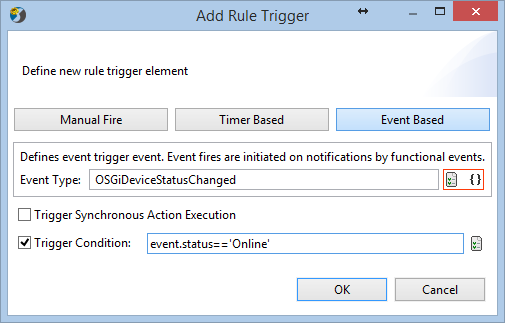
Selecting Trigger Condition checkbox allows you to write/import Groovy condition based on the data received by the event. For example:
event.status=='Online'The same 'event' object can also be used in the Script Action Groovy script.
Event Fields Metadata:
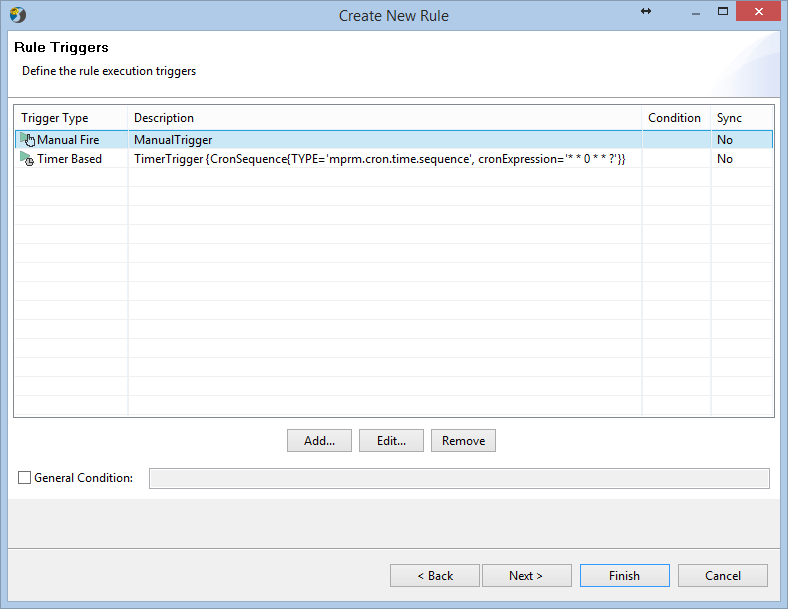
You can define multiple triggers for a single Rule. For example you may create a timer based trigger that will fire the Rule every day and also add manual trigger so you can fire the Rule at will:
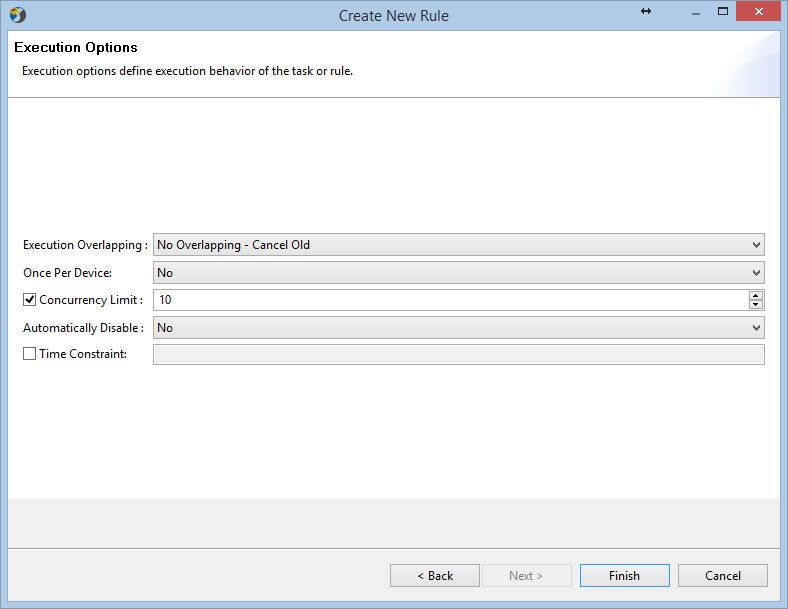
The final step is to choose the Execution Options (see the "Role Execution Options" sub-section from the Rule-Based Automation conceptual guide).
Execution Overlapping – (Allow Overlapping, No Overlapping – Cancel Old, No Overlapping – Skip New);
Once Per Device – (Yes/No);
Concurrency Limit – Defines the maximum number of concurrent devices for all running Tasks launched by the Rule;
Automatically Disable – (Yes/No);
Time Constraint – Defines the allowed working time for the Rule.
Enabling a Rule
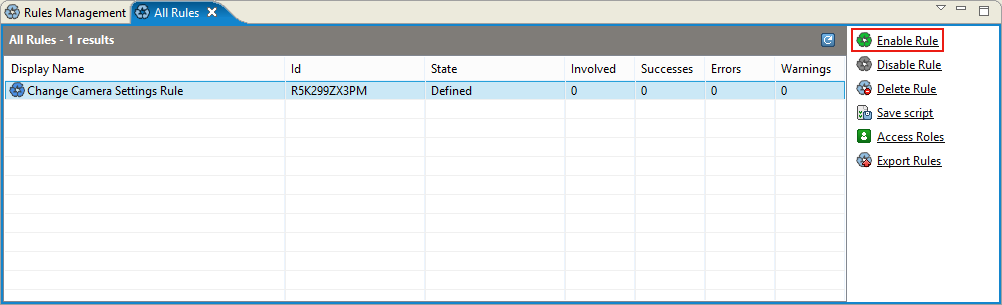
After the Rule is created it is in state – Defined. You must manually Enable the Rule so the Rule becomes Active.
For example if you want to activate manual trigger you need to enable the Rule first and then the option Fire Rule will be available.
Select the rule you want to enable and click Enable Rule from the right pane.
Editing a Rule
Rules may be edited only if they are NOT Enabled.
When you choose to edit a rule you go back through the Create Rule process and you may edit the Rule settings. Editing a Rule deletes all the execution information for this Rule. Therefore once you are done editing the Rule it will appear as newly created. The Rule must be enabled once again so it becomes active.
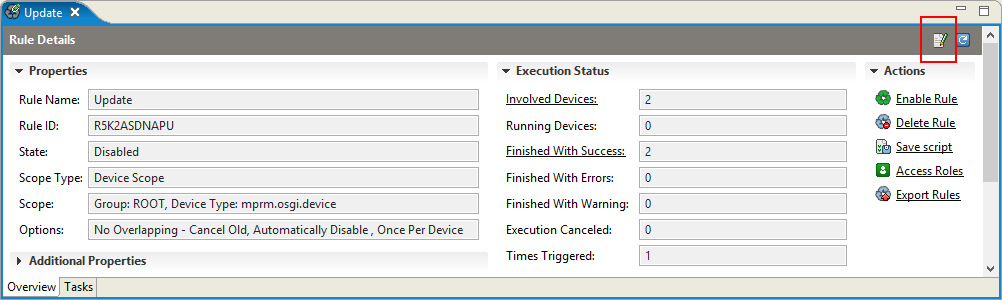
You need to click the Edit Rule icon in the Rule Details pane.
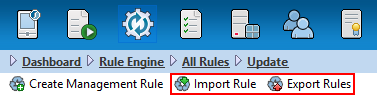
Apart from being created and edited Rules may also be imported/exported (see figure below).
Rules are imported/exported in JSON-format as text representation of the rule. One or many rules may be exported at the same time as a single file to the disk:
When exporting just 1 rule it is exported as text file (.rule).
If there are many rules exported at once the export is done as a ZIP archive with text files (each rule as a separate .rule file).
Rules may be imported later either in .rule or .zip format.
Cloning a Rule
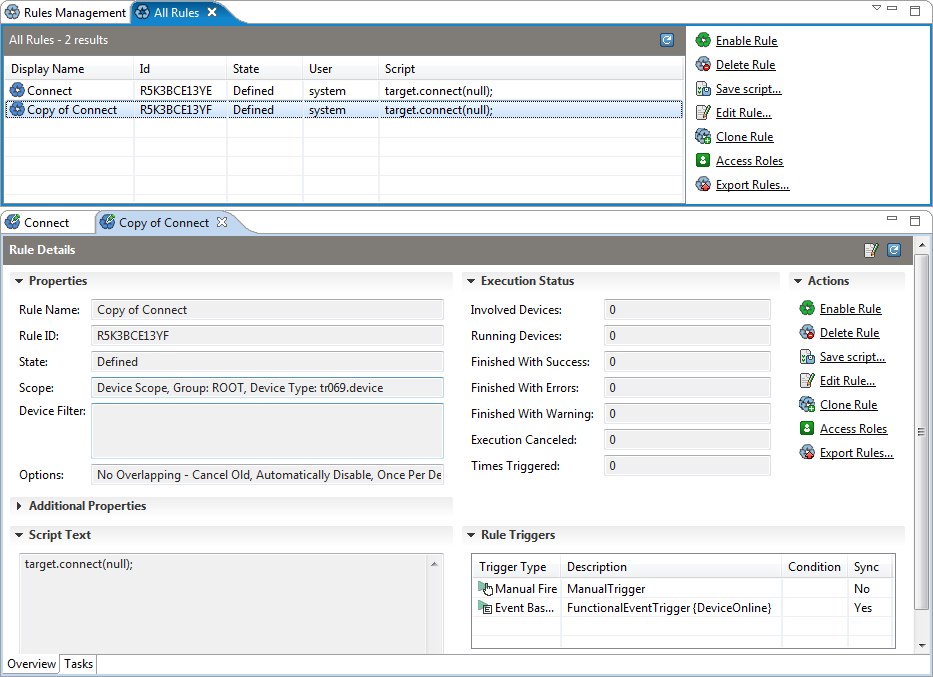
The Clone Rule action is very useful when generating a rule that is similar to an exiting one is needed.
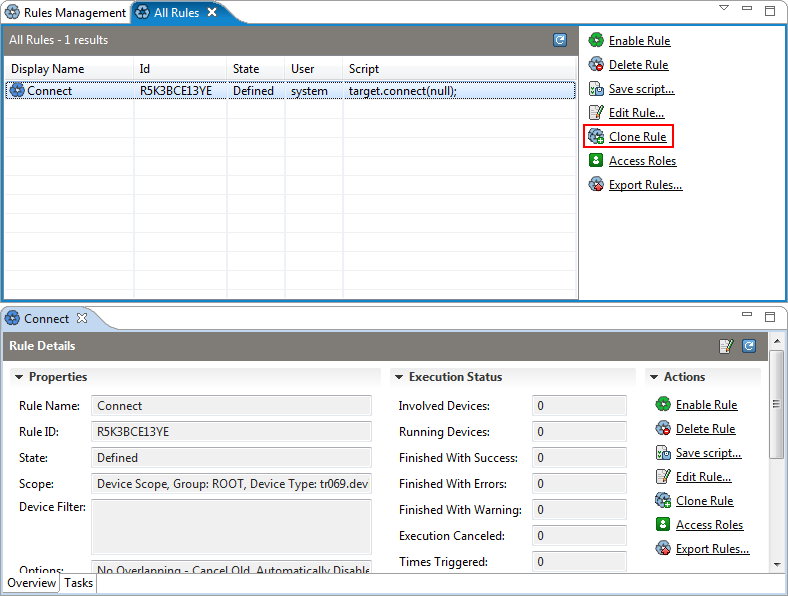
The cloned rule is in "Defined" status and has identical properties as the parent rule.
Searching Rules
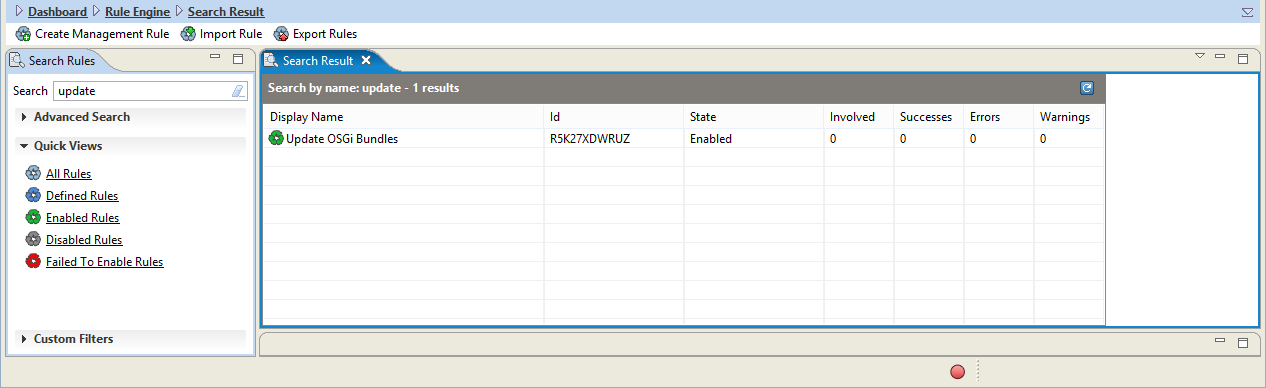
The Search option allows you to quickly find a Rule
You can search Rules by name. For example by entering "update" in the search field:
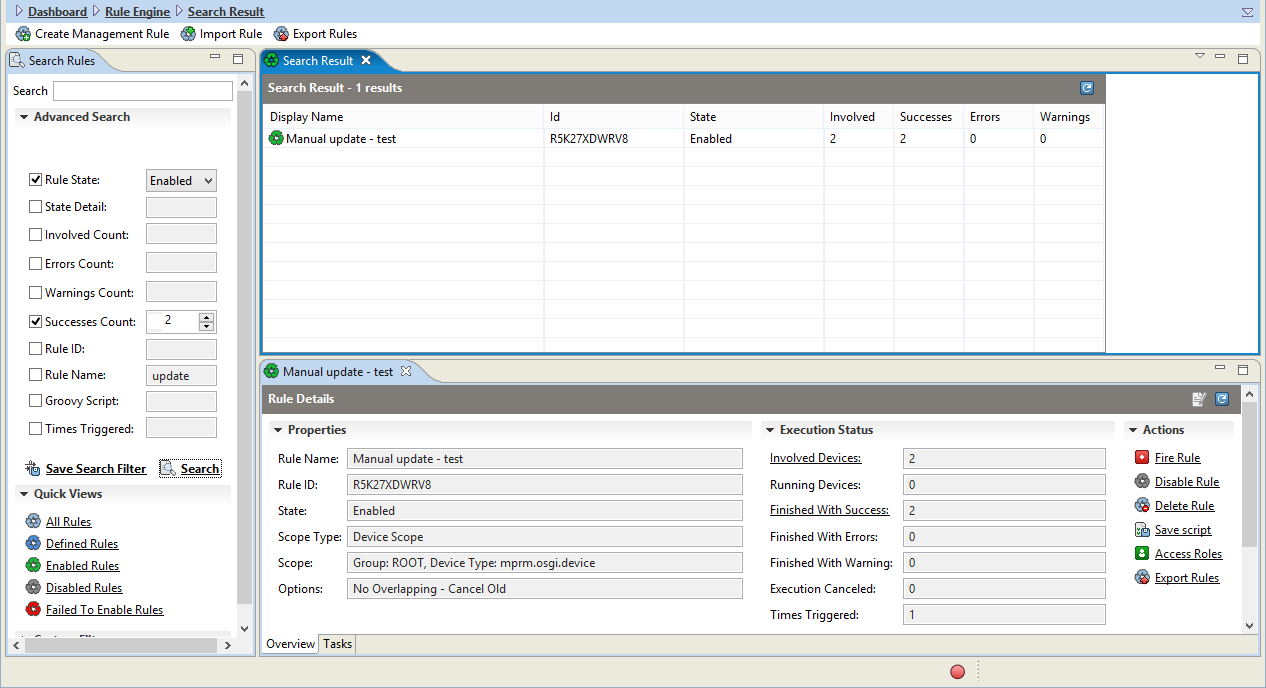
Alternatively you can use the Advanced Search option to create more complicated filters for refining results.
The following filter options may be set:
Rule State (Enabled/Disabled/Defined/Failed to Enable)
State Detail
Involved Count
Errors Count
Warnings Count
Successes Count
Rule ID
Rule Name
Groovy Script
Times Triggered
Monitoring Rules
Quick Views allow you to quickly filter the Rules by specific state:
All Rules
Defined Rule
Enabled Rules
Disabled Rules
Failed To Enable Rules
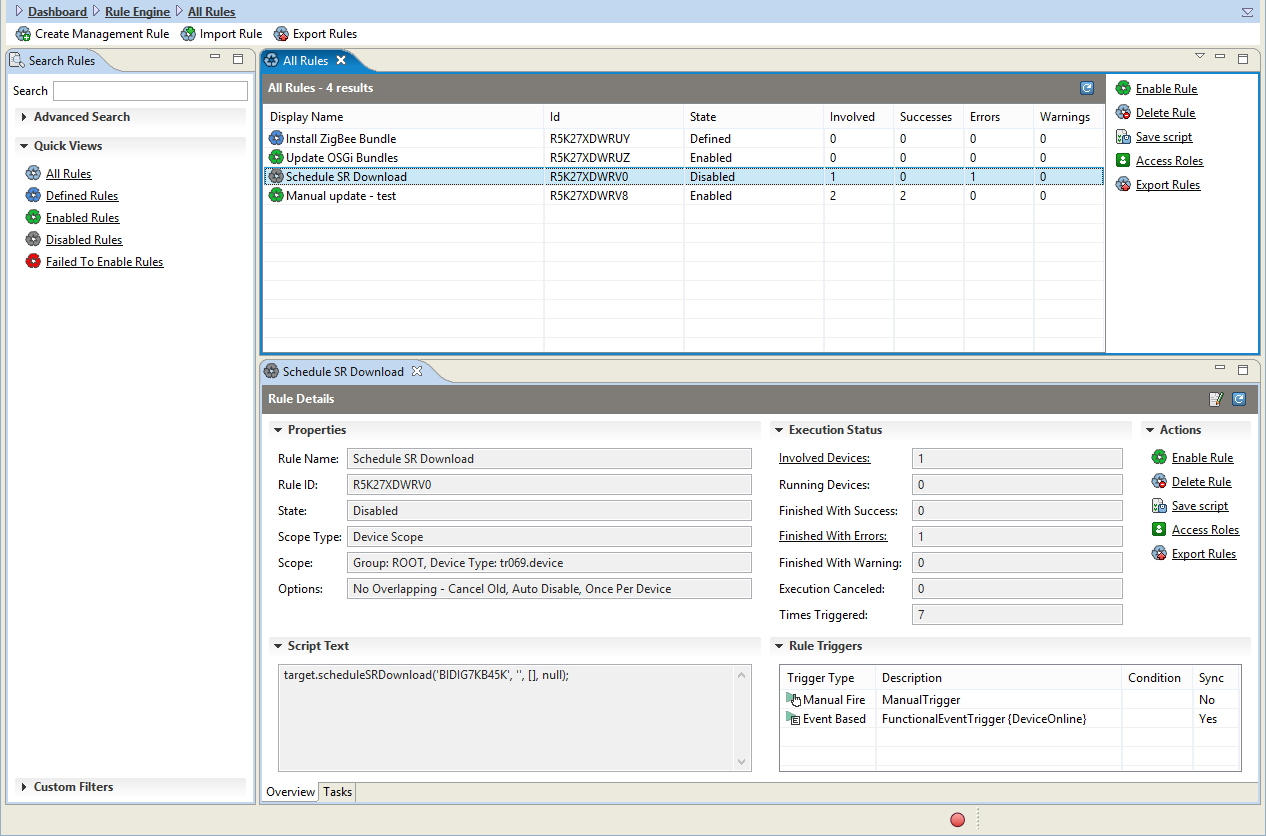
The Rule management provides detailed status info about the selected Rule. It allows monitoring the execution parameters (state, involved devices, times triggered, etc.).
The detailed info is organized in two tabs – Overview and Tasks.
Overview tab provides detailed info about the selected Rule (Scope, Options, Execution Status, Script contents, Rule Triggers, etc.) as well as its status (Number of involved and finished devices, number of triggers, etc).
Tasks tab (see Task Execution conceptual guide) lists all the Tasks that are launched by the selected Rule. The number of Tasks corresponds to „Times Triggered", but the Tasks tab provides detailed view for all the launched Tasks.
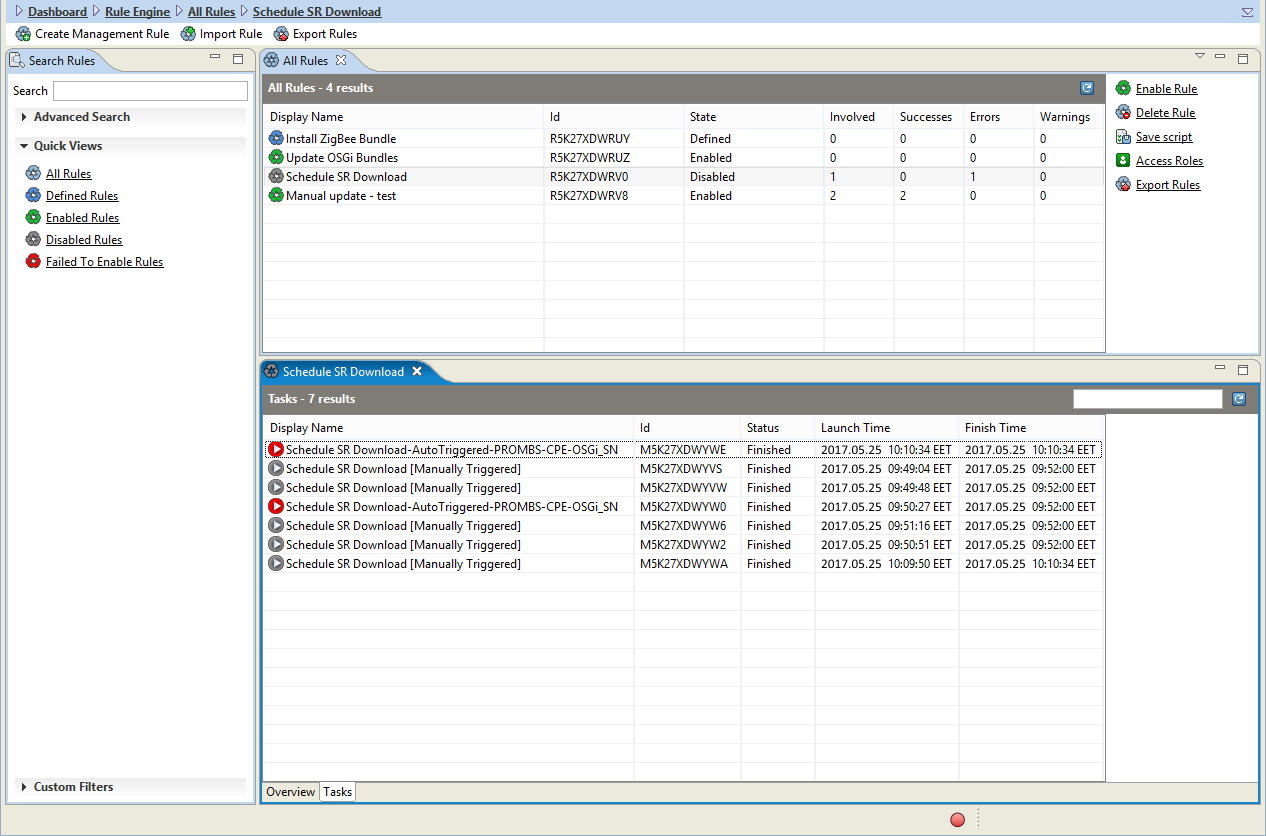
Additional details may be viewed by expanding a Task by double clicking on it:
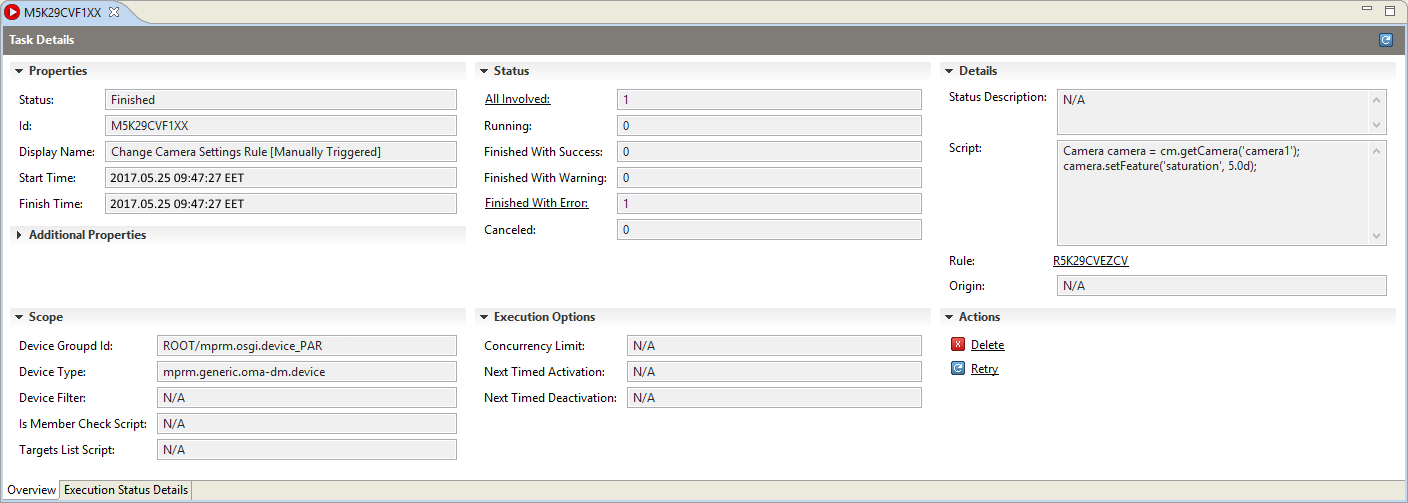
Notice that under Status section, the fields All Involved, Running, Finished, Canceled, etc. could be links that open a list of Device-Rule-Statuses (see Device Rule Status from the Rule-Based Automation guide) for each device that has executed the Rule with respective execution status (running, success, canceled). The same applies when monitoring Task details – a list of Device-Task-Statuses for each device executing the monitored Task is available.
This allows viewing all device executions per Task and Rule.
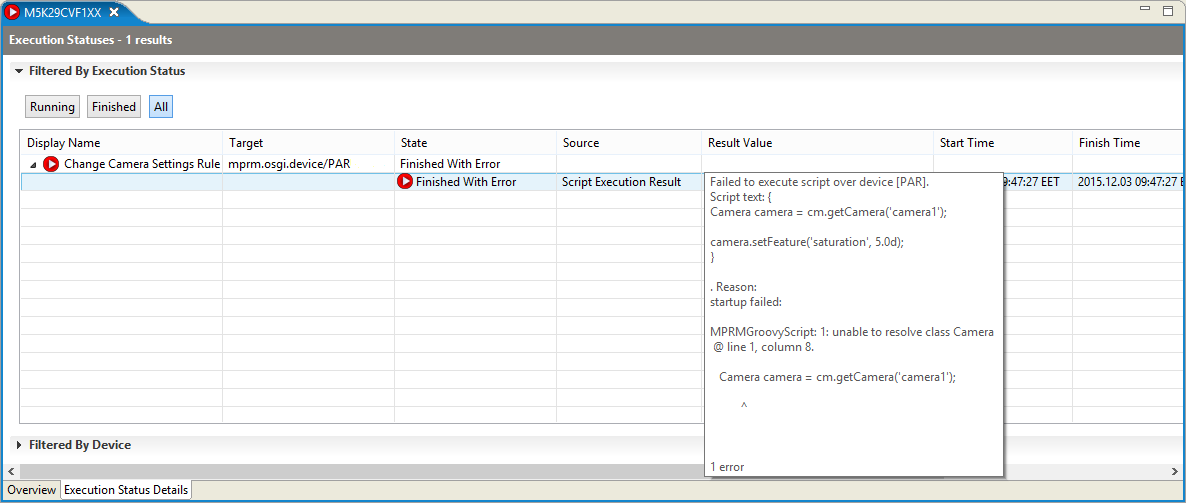
You can also check the opposite to view the Tasks and Rules for specific device.
You need to go to the Device Management perspective -> select the Device -> Task Executions. This brings up all the entries in the list that contain Device-Rule-Status and Device-Task-Status for the all the Rules and free Tasks for the particular device (free Task is a Task that is launched manually by the user, NOT by a Rule).
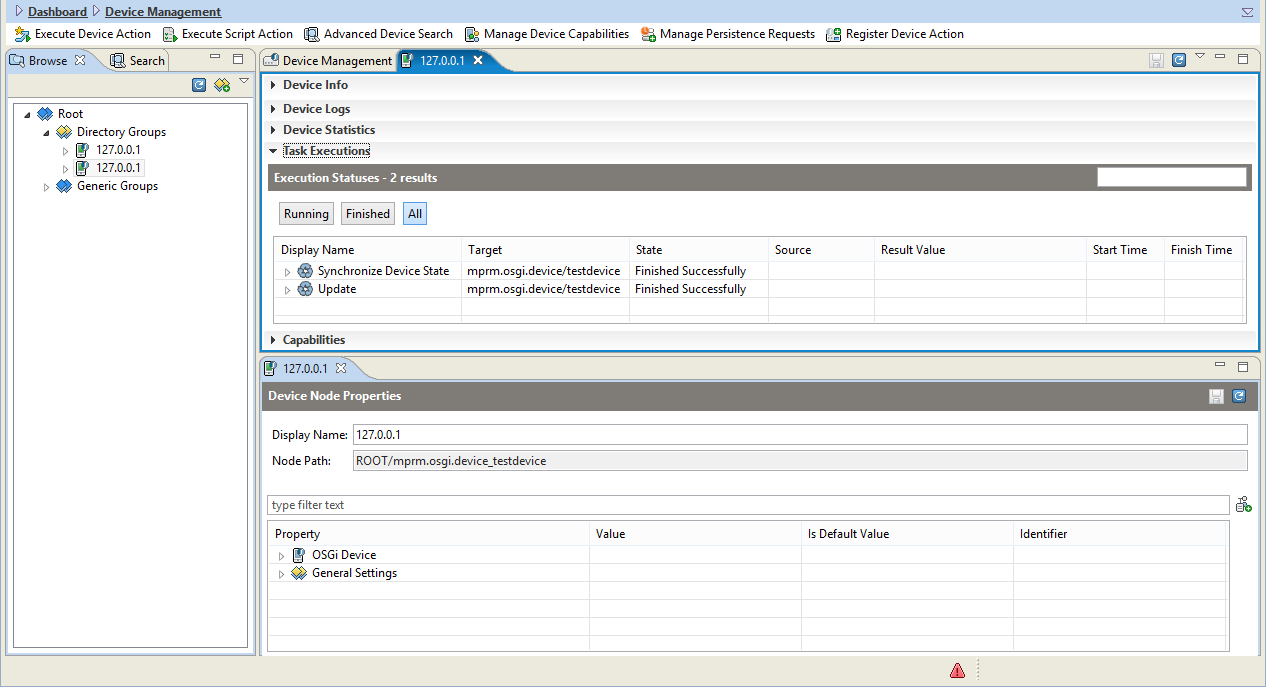
Device-Rule-Status entries have three levels of hierarchy. The Rule execution details can be seen below:
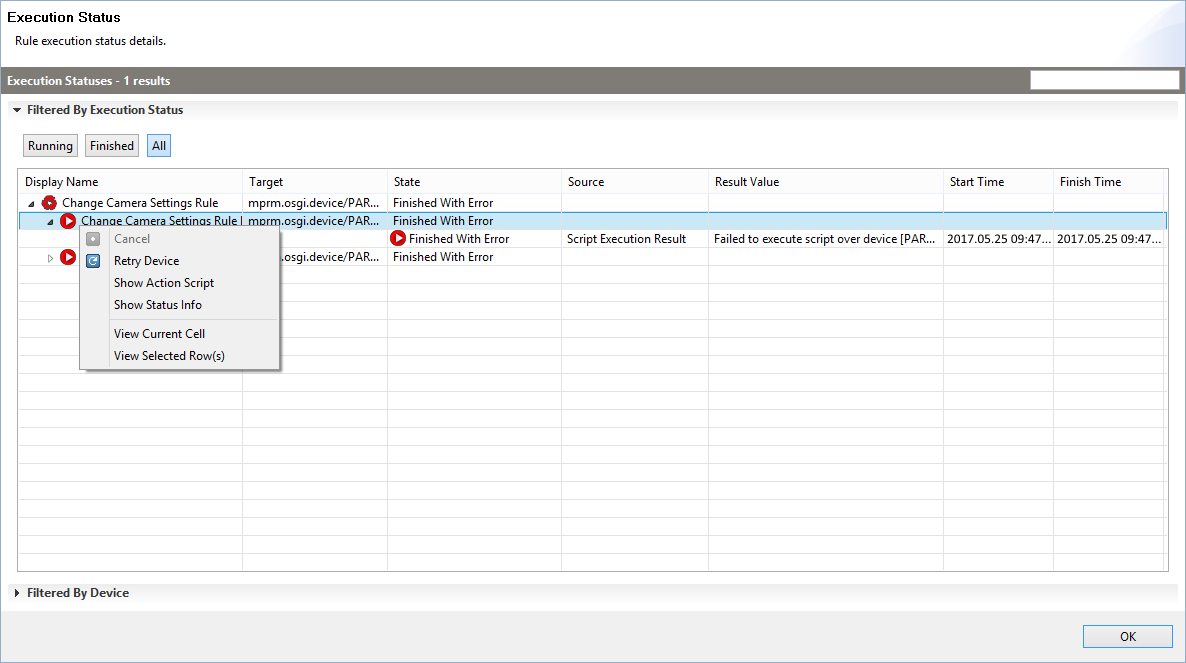
The Execution Status window provides list of entries for each device. The entries are hierarchical(3 levels) and may be expanded for more details:
At the first level we have the Rule status for the device.
At the second level we have the status of each Task which has the device included in this Rule.
At the third level we have detailed info for the partial results of the script executed for the device.
By right clicking on the second level you can Retry/Cancel the Device Task Status entry, or obtain more information about it.
Task information may be obtained by choosing the Execution Status Details tab, the difference is that the displayed entries have only 2 levels of hierarchy (the Rule level is not present).
Hovering with the mouse over the Result Value opens a new box that provides more information.