Overview
Following is a short description of the System Statistics generated by RM:
- JDBC Connections to <db_server_name> - Statistics about the Database Service connections to the <db_server_name> database server.
- Physical connections - Contains statistical information about the physical connections to the database server through the corresponding JDBC driver. The value of this statistic is always growing as opening a physical connection is a one-way operation - once opened, the connection is not closed except when the entire connection manager instance is terminated. The value of the statistic varies from 0 to the connection limit set for the database server. A new physical connection is opened when all already open ones are occupied and there is a new connection request to the database connection manager.
- Occupied read-write connections - Contains statistical information about read-write connections got by connection manager clients. One read-write connection is mapped to exactly one physical connection. This statistic is more dynamic and is updated every time a database connection manager client occupies or releases a connection. The statistic value can vary from 0 to (physical_connections - 1) as one physical connection is always reserved for sharing among all read-only client connections.
- Physical connections - Contains statistical information about the opened physical connections.
- Physical connections - Contains statistical information about the physical connections to the database server through the corresponding JDBC driver. The value of this statistic is always growing as opening a physical connection is a one-way operation - once opened, the connection is not closed except when the entire connection manager instance is terminated. The value of the statistic varies from 0 to the connection limit set for the database server. A new physical connection is opened when all already open ones are occupied and there is a new connection request to the database connection manager.
- JVM Memory - Statistics about the memory currently consumed by the host-local virtual machine.
- Platform Cache - Provides statistics about the current and used cache size.
- Device statistics (TR-069, OSGi, Java ME, OMA) - Contains basic statistics about the connected devices
- User Sessions - Statistics about the user login sessions to the RM system.
- Operation Statistics - Statistics about the management operations executed over devices.
In its Statistics dashboard view, the console shows statistics for the RM system, for the hosts sharing a common role, and for each management server. See Basic Concepts for further details about the statistics support of the RM.
Statistics View
To open the Statistics view, click the  button at the top of the console or select Dashboard -> Statistics. The view has several expandable sections providing options for searching specific statistics:
- Advanced Search - Allows defining filters for retrieving statistics according to special requirements such as particular backend role (control center, management server or remote access server) associated with resulting statistics and name containing specified string.
- Quick Views - Contains shortcuts for retrieving the system and device statistics.
- Custom Filters - Contains saved filters defined by using the Advanced Search section.
The console shows statistics in a hierarchical manner by name and then under each name, by type. The values of the defined statistics are shown as leaf nodes of the statistics tree, and their details appear underneath.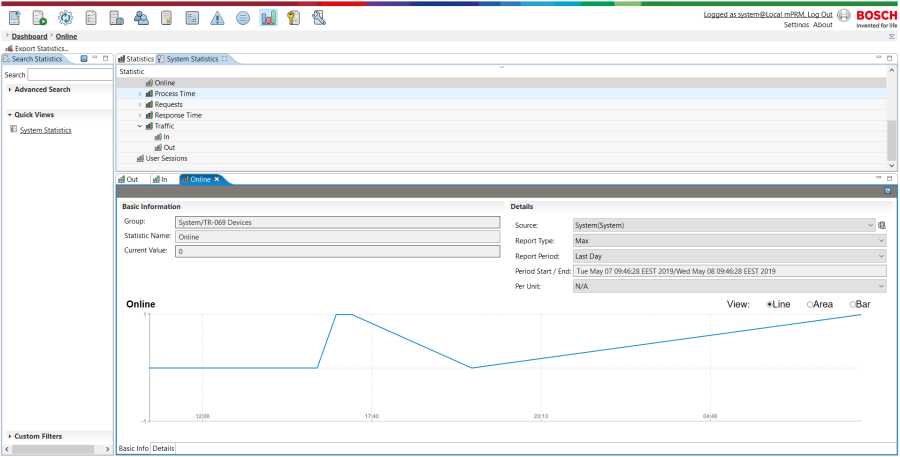
Statistics Details
The console allows the system administrator to view details about the variations of a statistic over a time period.
With the Get Details button, you can load statistical information filtered and processed according to the current settings:
- At Source you can choose between all the available sources for this type of statistics. Alternatively you can click on the
 icon and manually enter the Source Type and Source Name of the statistics that you want to be displayed.
 - At Report Type you can choose between the available types options for this statistic.
- At Report Period you can set the time period for which you want to get the statistical information. You may choose one of the ready period definitions Last Hour, Last Day, Last Week and Last Month. Otherwise, to filter the statistic's values within a custom period of time, select Choose a Period Start Date and specify the start and the end of the period. Selecting User Defined without specifying start and end time of the period will lead to retrieving all values of the statistic.
- Per Unit - If available for the selected statistics you can choose the values to be converted per time unit (For example a statistic that represents received bytes could be seen by the user per hour - e.g. bytes per hour.)
The chart pane at the bottom contains a chart expression of the statistical information. The available chart types are:
- Line View - The chart is a line showing smooth transitions between different values in adjacent periods.
- Area View - Similar to Line View chart but the area is colored for better perception.
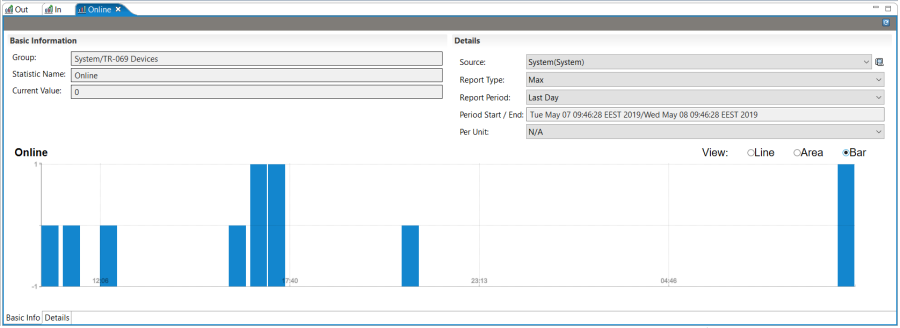
- Bar View - The value for each time period is represented by a graphical bar.
Representation of Statistics
- Basic Info - displays the statistics details that may be adjusted as well as the graphic of the change.
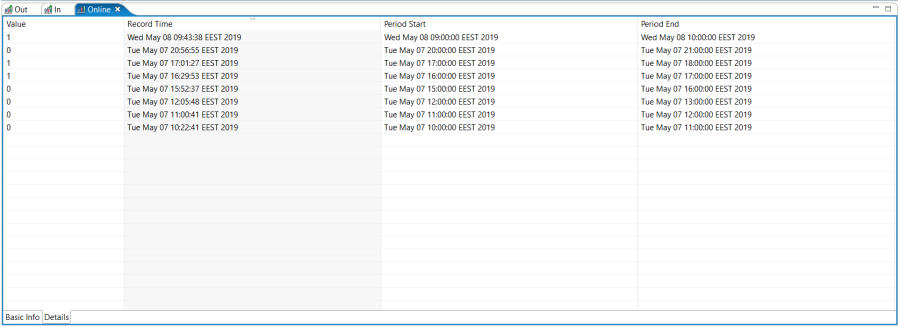
- Details - displays the detailed statistics with the selected granularity (e.g. minute by minute).
Searching Statistics
In the Search expandable section of the Search Statistics pane, you can narrow the amount of visible statistic components by specifying the Statistic Name or Group Name. Simply enter the name of the statistics that you need (e.g. "Used", "Price", "System", etc.).
Finally, click the Search action to apply the filter. You can save the filter and apply it again from the Custom Filters section.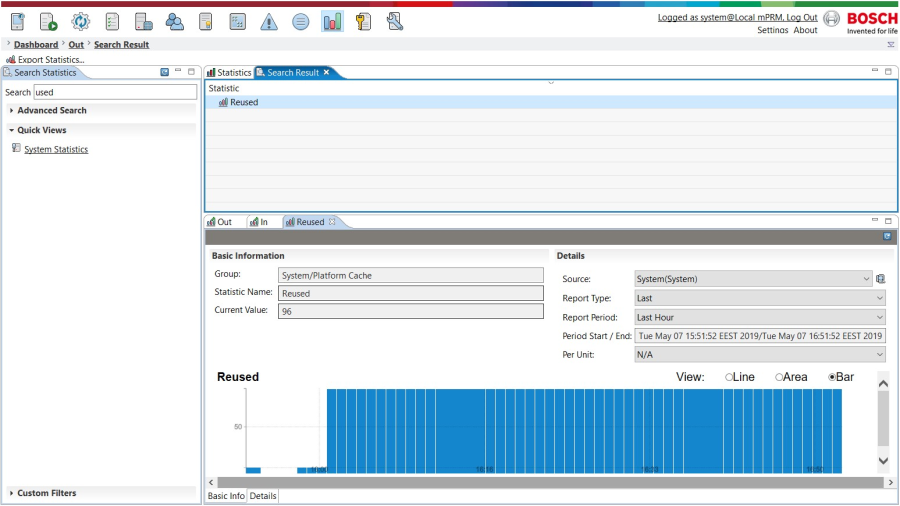
Advanced Search
The Advanced Search option gives you the option to easily find the statistics that you need by selecting one or more of the following options from the drop-down menus:
- Group
- Source Type
- Source Name
- Statistic Name
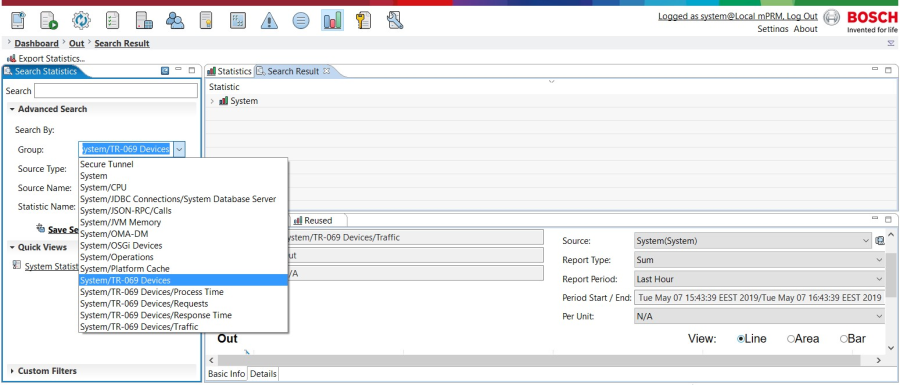
After you have selected the search criteria simply press the Search button.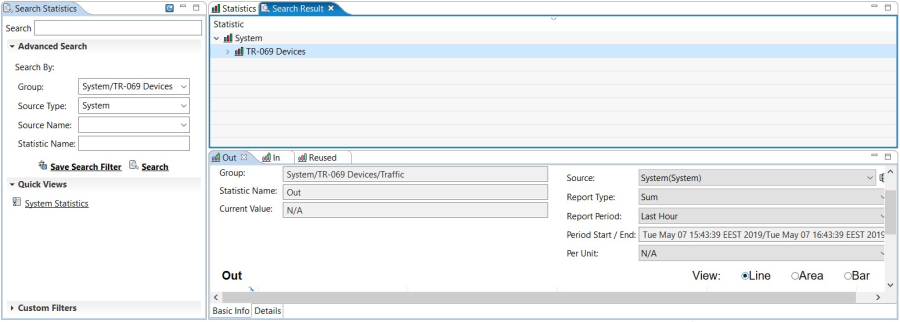
Additionally you have the option to save search filters for later use by clicking on the Save Search Filter option.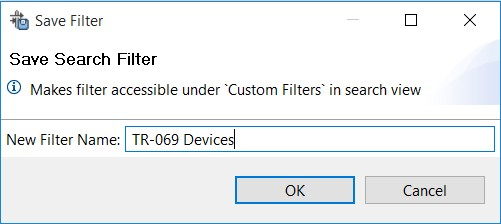
The saved filters may be later found under Custom Filters in Search Statistics pane on the left.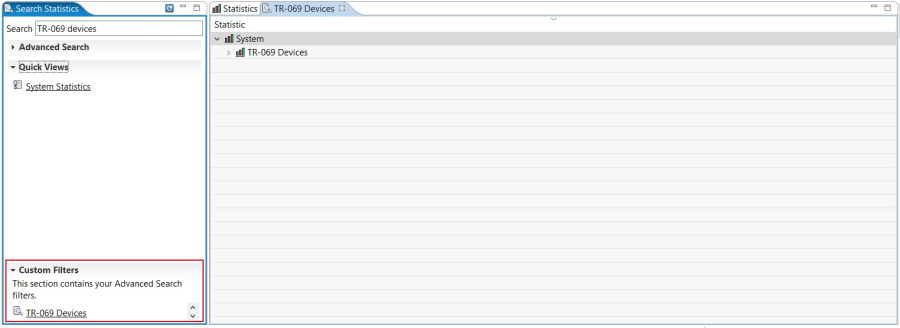
Exporting Statistics
The RM allows you to Export Statistics to a .CVS file and store it for later use.
To begin the process just click on the Export Statistics link as shown in the figure below.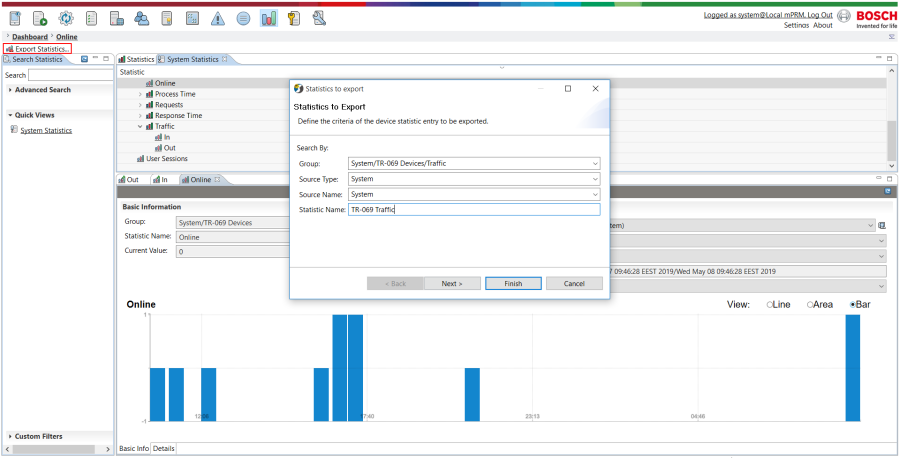
On the next screen you can adjust the statistic details before exporting.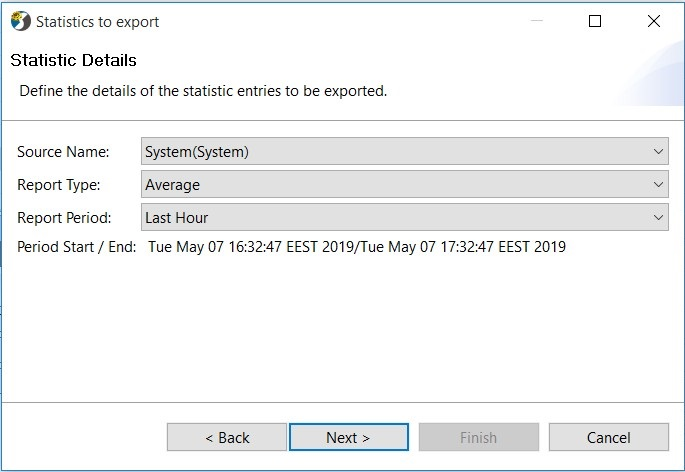
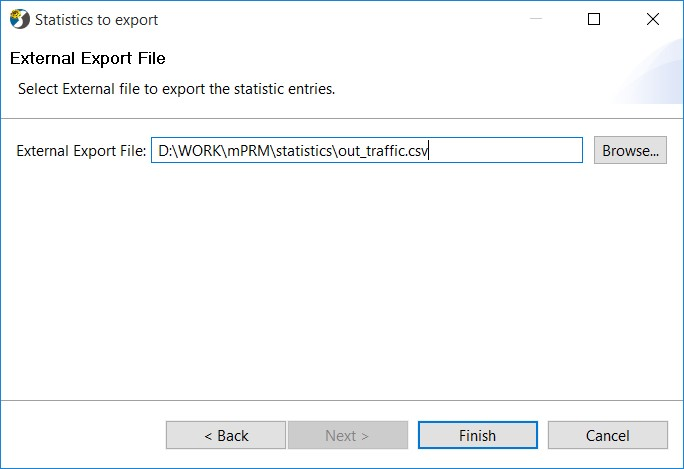
And finally you have to choose where to save the statistics.