Provides information about using the Alert Board
The Alert Board node of The RM Console allows you to view the alert messages available in the Alert Board Service. Alerts can notify of malfunctioning in the system that has resulted in serious error or requires human assistance.
General Description
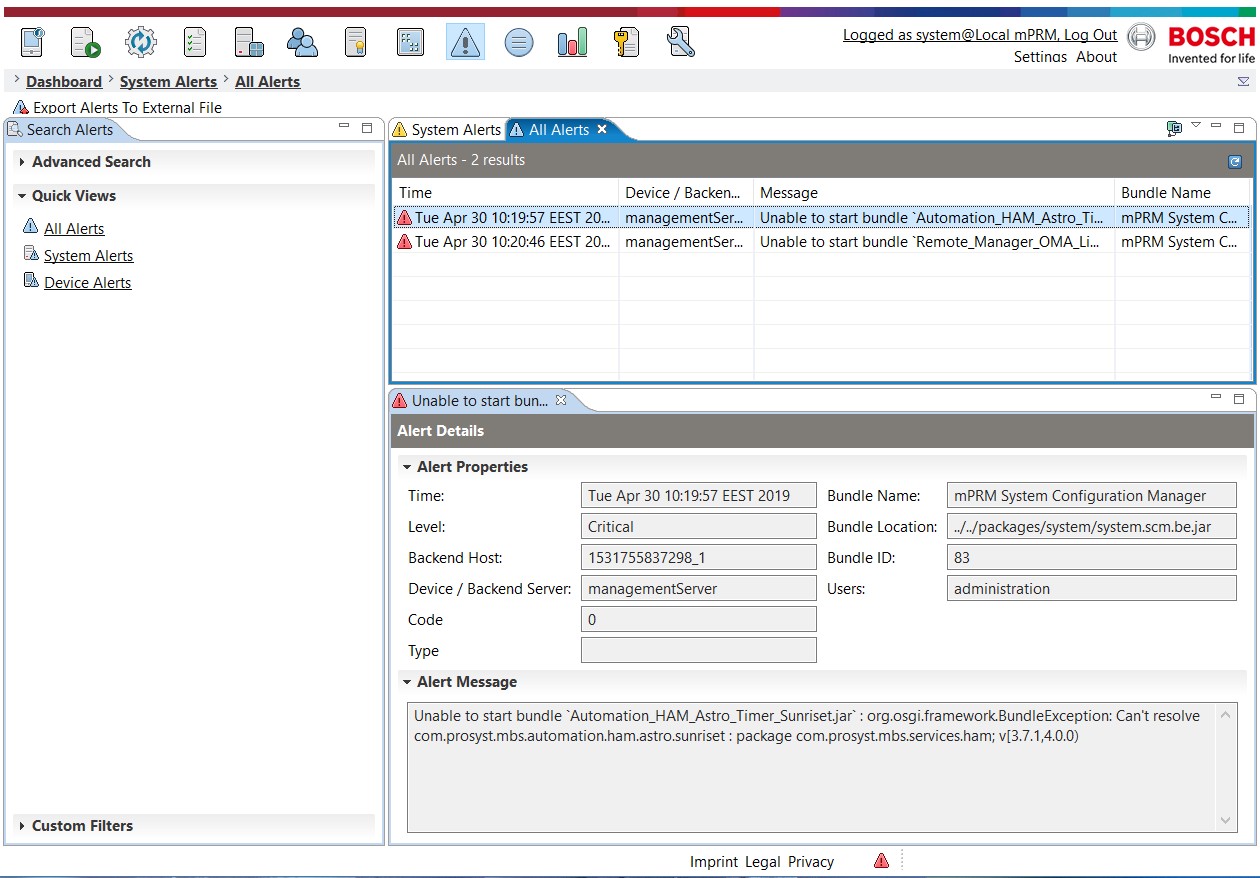
Alert messages can be retrieved and viewed through the Alert Board view of the The RM Console dashboard - click the  button from the toolbar at the top of the console or go to Dashboard -> System Alerts.
The Alert Board view has expandable sections - Quick Views, Advanced Search and Custom Filters. The Quick Views section offers shortcuts to all generated alert messages, to alerts related to the backend and to alerts related to controlled devices. The Advanced Search one allows you to filter the alerts by specific criteria, and then save the filter and apply it again from the Custom Filters section.
The alerts that satisfy the selected condition from the expandable sections appear on the right, sorted in groups by time of occurrence and level.
The icons generally used to describe alert levels are:
 - Represents critical level error alerts.
 - Represents middle level error alerts.
 - Represents low level error alerts.
How The RM Console Signals for Alerts
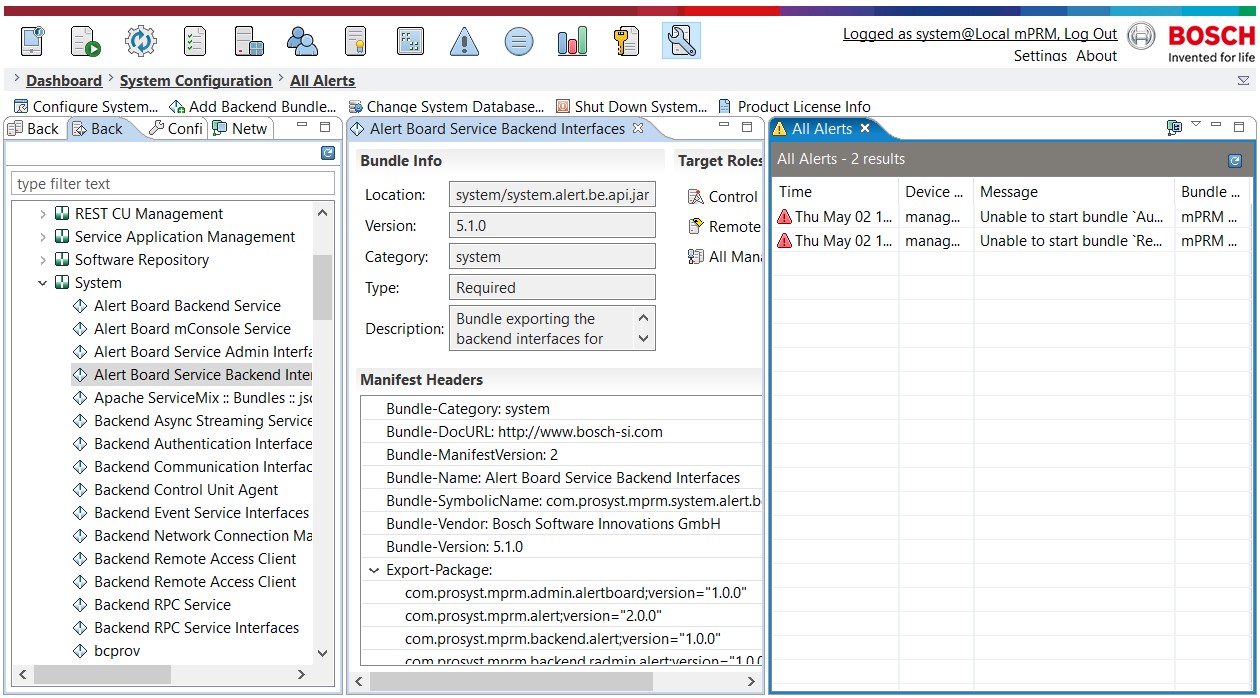
When an alert is raised, the  button in the system monitoring bar on the bottom right of the the RM Console becomes active. You can use it to view the last occurred, unreviewed alerts, that has the highest alert level. They are shown in a separate pane All Alerts and you are able to examine the alerts without the need to switch to the System Alerts dashboard view.
Alert Properties
The following properties for a selected alert appear underneath the list of alerts:
Time - Contains the exact date and time of the alert's raising.
Level - Indicates the error level (Critical, Middle or Low) of the alert.
Backend Host - Contains the ID of the host originating the alert.
Device/RM Server - Contains the ID of the managed device for which the alert is raised or of the MS if the host raising the alert has the management server role.
Bundle Name - Shows the name of the bundle that originated the alert.
Bundle Location - Indicates the URL of the bundle, originator of the alert.
Bundle ID - Contains the ID of the bundle sending the alerting message.
Message - Contains the message describing the alert. It has a pop-up menu that allows you to copy the text.
Retrieving All Alerts
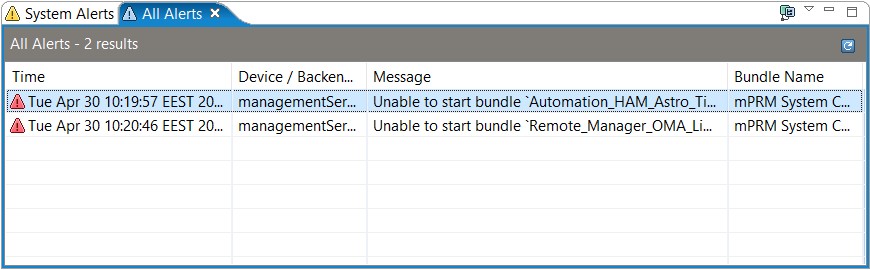
To view all generated alerts, go to the System Alerts view of the The RM Console dashboard and click All Alerts from the Quick Views section. An All Alerts pane will appear on the right:
Filtering Displayed Alerts
If you want to view alerts filtered by certain criteria, go to the System Alerts dashboard view and use the filter options provided in the Advanced Search expandable section:
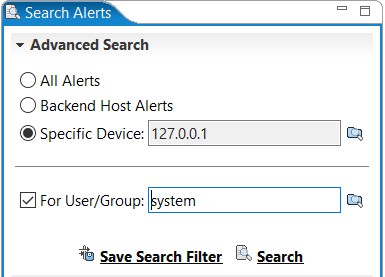
There are two different sets of filter criteria that can be set - criteria on a backend host/managed device and criteria on a user role. The search is performed according to resulting combined filter.
Specify the Advanced Search options attributes:
All Alerts - You will get all alerts.
Backend Host Alerts - You will get only the alerts related to the hosts of the RM backend.
Specific Device - You can also view the alerts concerning a certain managed device. To view alerts generated for a certain device:
Use the browse button
 next to the Specific Device field.
A Device Browser dialog appears.
Choose managed device from the dialog.
Click OK to confirm.
For User/Group - You can search for alerts whose target is a specific user or group. To use this option, use the browse button
 and select the user role of interest. If nothing is specified in this field, the display filter will be applied to all users and groups.
Finally, click the Search action to apply the filter.
Saving a Filter for Further Use
The RM Console gives you the option to save a filter and then apply it again on generated alerts. By this saving you the efforts to define complex search criteria again and again. To save a filter:
Define the filter attributes in the Advanced Search section as described in "Filtering Displayed Alerts".
Apply the filter by selecting the Search action.
Once the search is complete and results displayed, click the Save Search Filter action.
Name the search filter and click OK.
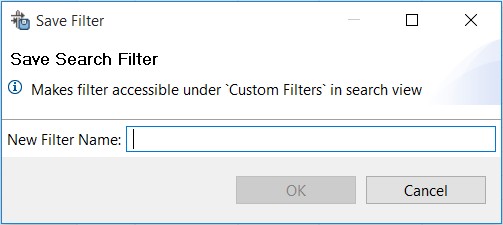
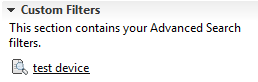
The filter will be added to the Custom Filters expandable section. To apply it, simply click on it.
A saved alert filter:

Exporting Alerts to a CSV File
You can save specific alerts exported to a CSV file. The exported file could be opened in a spreadsheet management application and explored in details.
To export alert records to a file:
Click the Export Alerts to External File action from the administrative toolbar at the top. An export wizard appears.
In the Alerts to Export step, specify the attributes of the alerts that should be exported. The filter options are similar to the ones in the Advanced Search section of the System Alerts view. Click Next to proceed.
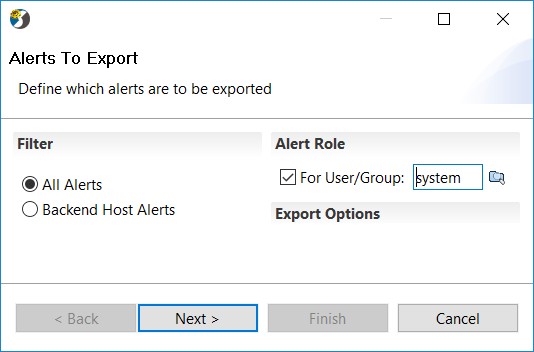
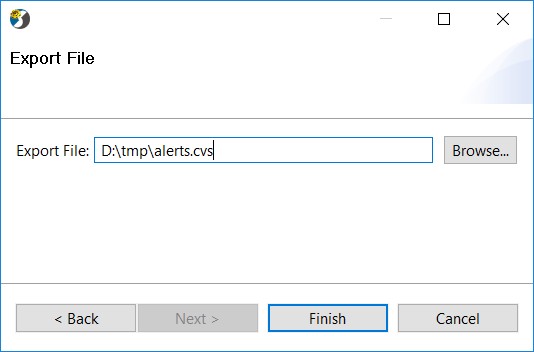
In the Export File step, specify the location of the CSV file to save logs to and click Finish.