Add a Bar chart for the octopus device
In Bosch IoT Insights add a new Bar chart to visualize the temperature values over time.

The Bosch IoT Insights dashboard allows - among others - to explore your data forwarded by Bosch IoT Things and to visualize the values in a chart.
This example shows how to create a bar chart displaying the temperature values.
Prerequisites
At this point, we assume you have already configured the connection to forward data from Things to Insights, and that your octopus device policy explicitly allows the forwarding.
Find the specific data that should be displayed
Login an the Insight dashboard
Explore > Data Browser
Each event forwarded by Things is visible there as an object
Click Expand all to see the complete structure
Point your mouse to all fields you are interested in, and click copy path to save this to your clipboard
In our example
payload.features.ambient_temperature.properties.status.sensorValue
payload.timestamp
Explore > Data Analyzer
Here you have the possibility to limit the data.
However, for our minimal example where we did the "filtering" by the restrictions in the policy, the "default query" should be sufficient.
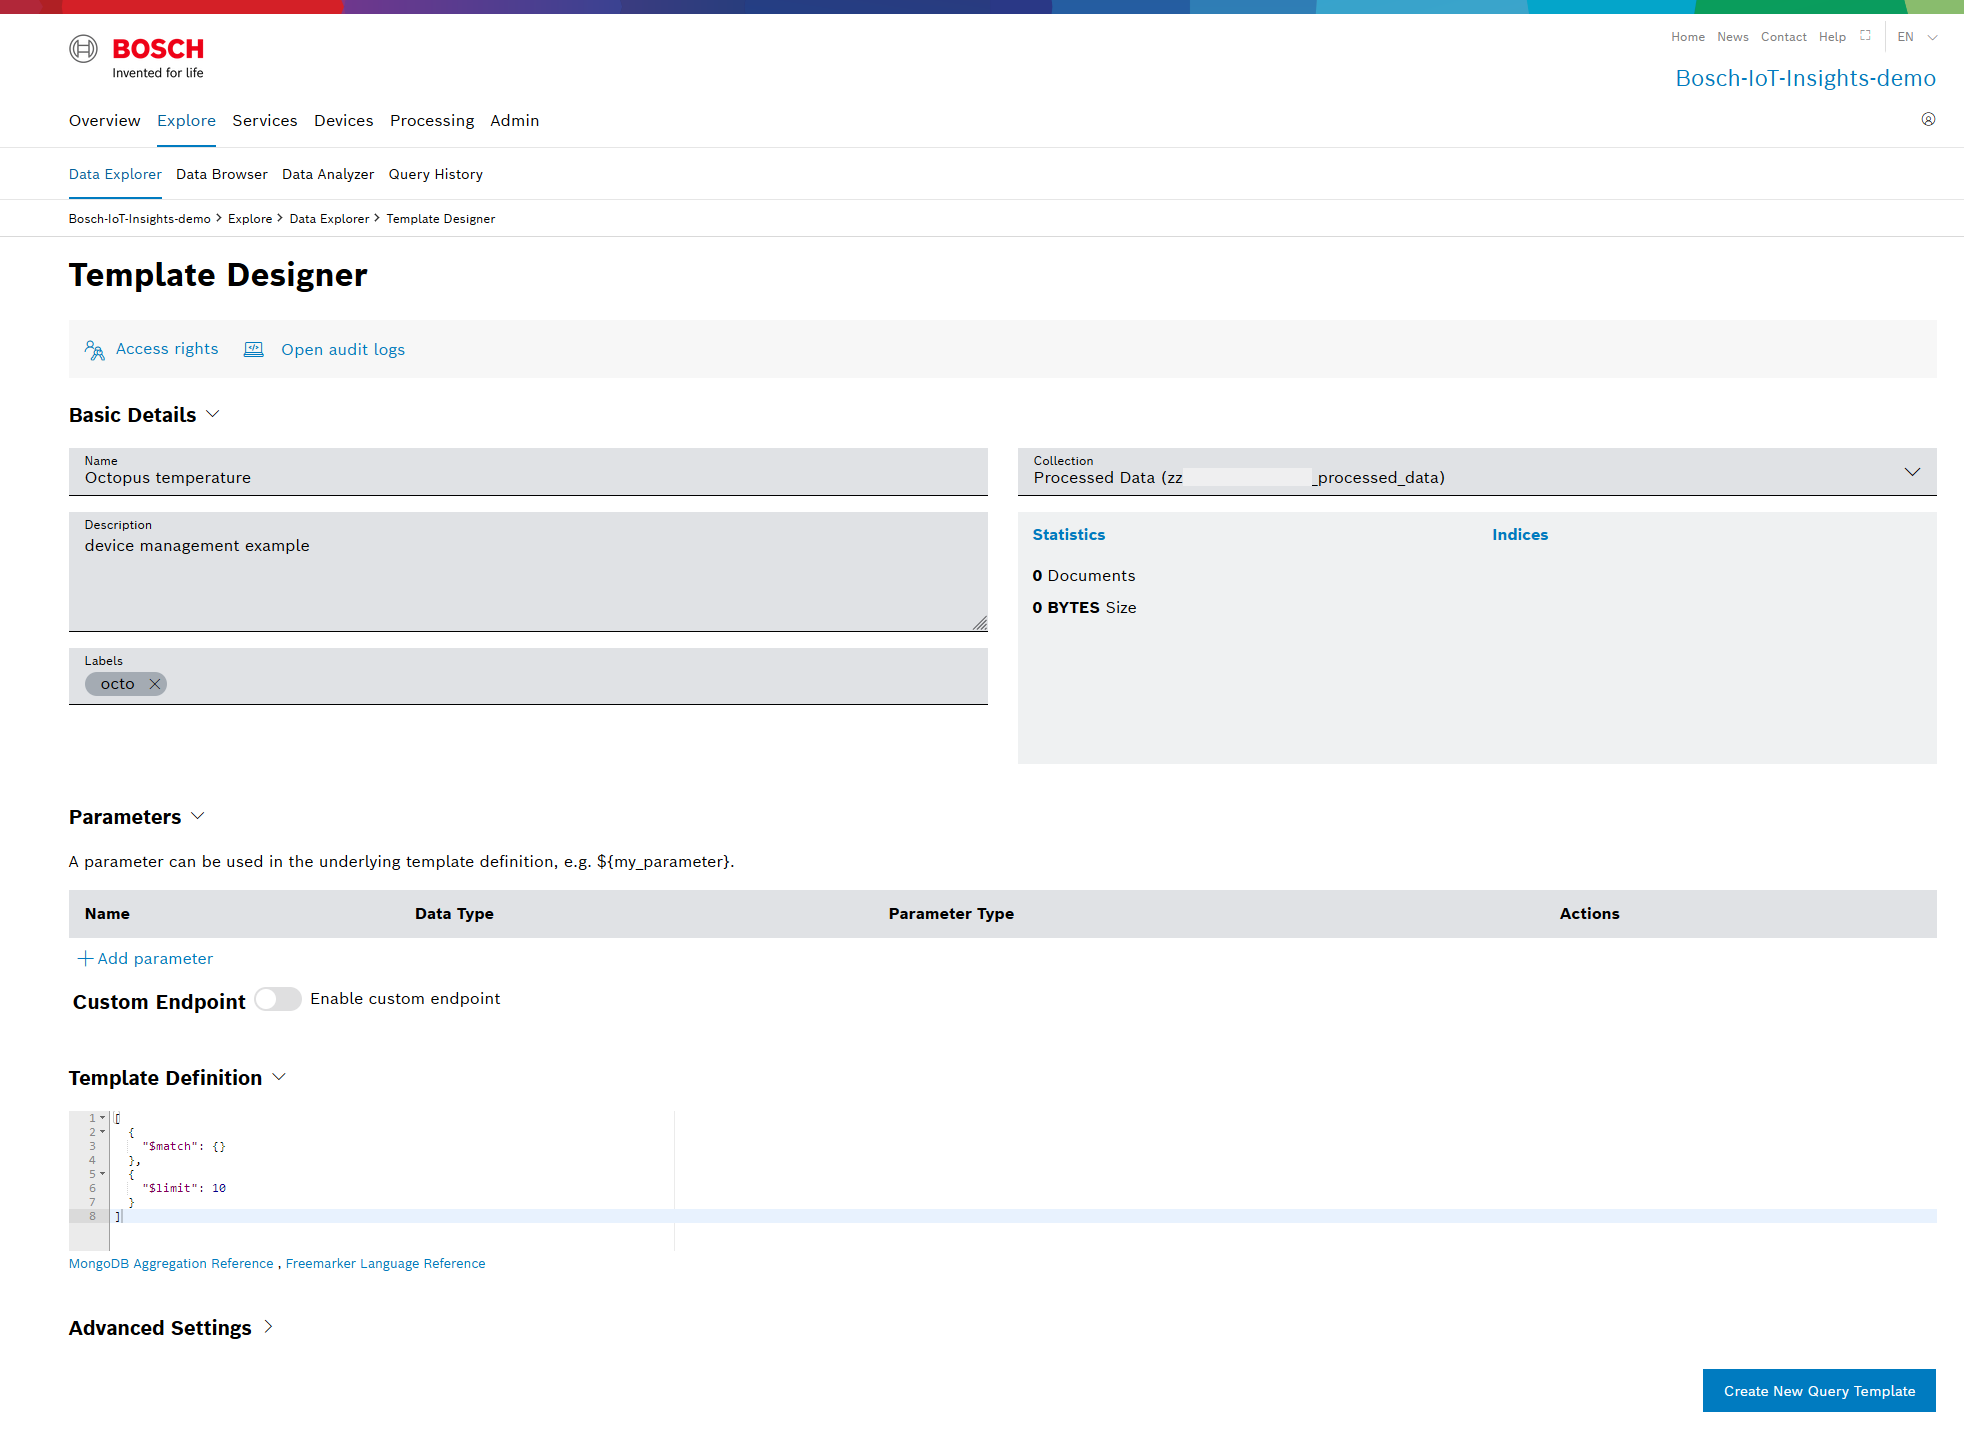
Explore > Data Explorer > Add template
Set a name for the template in order to find it again at a later point in time and don't forget to check the box "share with other project members"
Add a bar chart to display the values
Scroll down to the very end of your Overview page
Click Add widget
From the General view select Bar chart
The Chart Widget view will mark red all input filed missing default settings
As a Data Source now you can select
Query template > your own query template created in the section above > Save data source
The Widget Preview - at the right side - show that some settings are still missing.
For the X-Axis Data select [i].payload.timestamp - this is the time when Things service has modified the data.
For the Y-Axis Data select [i].payload.features.ambient_temperature.properties.status.sensorValue - this is the value measured by the octopus temperature sensor.
Click Add to have this widget rendered on your "Overview" page.
By default, the widget shows up at the end of the page.
If you need the size or the title adjusted:
Click Activate Editing at the end of your Overview page
Then click the edit icon in the upper right corner of the chart.
e.g. to adjust the width edit Dashboard settings > Size > Half (2 Columns)Click Save to end the editing dialog.
If you want to see the chart at the start of the page:
Click Start sorting at the end of your Overview page
Drag and drop the widget to the top
Finish sorting.
Please remember, that filtering the amount of data at the step "Explore > Data Analyzer" will be crucial when working with more than "lab data" of one device.
https://bosch-iot-insights.com/static-contents/docu/html/Introduction.html