Running the Client
You can start the Tunnel Client using one of the following methods:
Method 1: Double-Click (Standard Use)
This is the simplest way to run the client.
Navigate to the directory where you saved the
TunnelClient.jarfile.Double-click the
TunnelClient.jarfile.
Note: This method requires Java to be correctly installed and configured on your system to associate .jar files with the Java Runtime Environment. If the client does not launch, please use Method 2.
Method 2: Command Line (Standard Use)
This is a reliable alternative to double-clicking.
Open your command-line interface (e.g., Terminal or Command Prompt).
Navigate to the directory where you saved the
TunnelClient.jarfile.Execute the following command:
java -jar TunnelClient.jarMethod 3: Command Line in Debug Mode (For Troubleshooting)
Use this method if you need to gather detailed logs for troubleshooting purposes.
Open your command-line interface.
Navigate to the directory where you saved the
TunnelClient.jarfile.Execute the following command to run the client in debug mode:
java -Dwstunnel.debug=true -jar TunnelClient.jarAfter successfully executing any of these methods, a new window for the Tunnel Client should appear on your screen. When running in debug mode, additional logging information will be printed directly into your command-line window.
Understanding the Tunnel Client UI
If the connection is successful, the main client window will appear. It displays a list of entries, one for each of the Target IDs you selected.
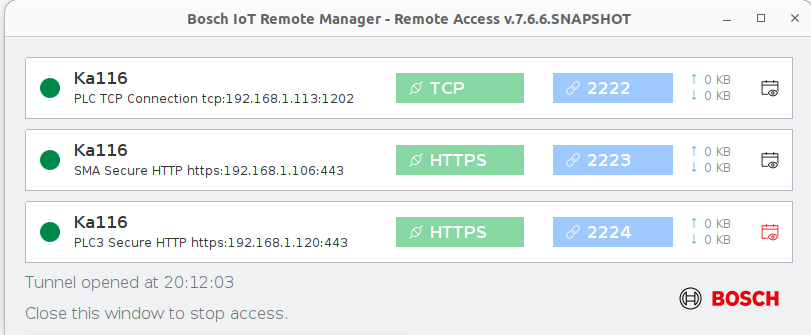
Here is a breakdown of each part of an entry, from left to right:
Status Indicator
The colored circle on the far left indicates the connection status.
Green: The tunnel is active and running correctly.
Red: There is a connection error. Hover over the circle to view a tooltip with details about the error.
Target Information
This section displays details about the connection target.
Gateway Name: Displayed in bold at the top.
Target Schema: Shown below the gateway name.
Port and Protocol Labels
These labels show the protocol and local port configured for the tunnel.
Note: These can be customized in the Web Console's RSA perspective before you download the client.
Traffic Monitor
This panel displays real-time incoming and outgoing data traffic for the tunnel.
Validity Status
The icon on the far right shows whether the access request is still valid.
Black Icon: The request is currently active and valid.
Red Icon: The request has expired.
Error Handling
The Tunnel Client provides clear visual cues when an error occurs during initialization. The appearance of the window will differ depending on the nature of the error.
Scenario 1: No Tunnels Started
If a critical error prevents any tunnels from initializing, the client will display an empty window.
What you will see:
The main window area will be empty, with no tunnel entries.
Informational and error messages will be displayed, explaining the cause of the failure.

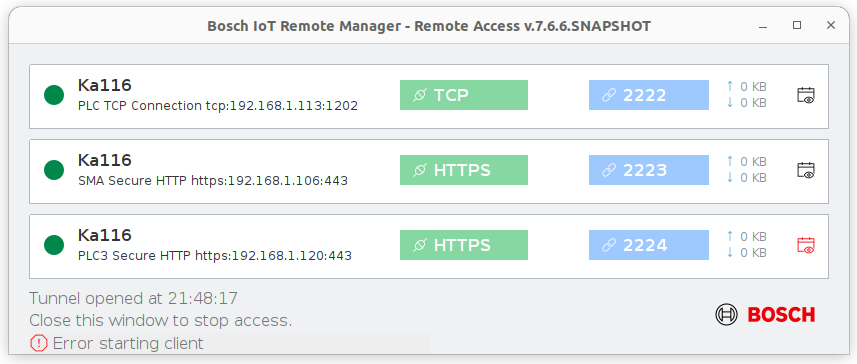
Scenario 2: Some Tunnels Fail to Start
If some tunnels connect successfully but others fail, the client will still display the successful connections.
What you will see:
The successfully connected tunnels will be listed as usual.
An error label will appear at the bottom of the window, providing details about the connections that could not be established.
Troubleshooting
Cannot Connect to Tunnel
Symptom: Client shows "Connection Failed" or timeout
Possible Causes:
- Access code expired
- Network/proxy blocking WebSocket
- Invalid Remote Manager URL
- Gateway offline
Solutions:
- Check Code Validity:
Look at client UI "Valid Until" field
If expired, request new code from administrator
- Verify Proxy Configuration:
   # Windows
   set HTTP_PROXY=http://proxy:8080
   set HTTPS_PROXY=https://proxy:8443

   # Linux/Mac
   export HTTP_PROXY=http://proxy:8080
   export HTTPS_PROXY=https://proxy:8443
- Test Remote Manager Connectivity:
curl -v https://rm.company.com:443/remote/tunnel - Check Gateway Status:
- Contact administrator to verify gateway is online
- Check Management Console for gateway connectivity
Local Port Already in Use
Symptom: "Port already in use" error
Possible Causes:
- Another application using the local port
Solutions:
Use Different Port:
Request new client with different local port
- Stop Conflicting Application
Access Denied
Symptom: "Access code invalid" or "Gateway not found"
Possible Causes:
- Code was revoked
- Code expired
- Wrong gateway
- Code not synchronized to gateway
Solutions:
- Verify Code in Management Console:
- Check if code still exists
- Verify validity period
- Confirm gateway association
- Request New Code:
- Contact administrator
- Generate fresh access code