The RM State Monitor module provides valuable maintainability metrics that come in handy for troubleshooting and system monitoring purposes.
Overview
The RM State Monitor module provides the current Remote Manager status. It checks the RM Alert Board and monitors the RM virtual machine for deadlocks on a periodic base and then logs the current status in the RM log. When a deadlock is detected, a critical alert is raised on the RM Alert Board. The RM status is considered as healthy and operational if no alerts are raised on the RM Alert Board. When the RM is healthy and operational a message is logged. When a critical alert is raised, the RM Status is considered as not fully operational and the critical alert is logged. When a non-critical alert is raised the RM status is considered as operational with some warnings.
RM Status Information
There are two ways of obtaining the RM status information:
- using the RM script with argument status
- using the Status page ( https://<RM_HOST>:<RM_PORT>/status) URL
When used with the RM script the following exit codes should be taken into consideration as they indicate the operational status of the Remote Manager:
- Exit code
- 0 - Success, Operational
- 1 - Warning, Operational
- 2 - Error, Not Operational
- >2 - Fatal Error, Not Operational
Using the Status Page
The Status Page can be found at URL: https://localhost/status. Accessing it requires HTTPS connection per default .This requirement can be altered by changing the value of the system property mprm.monitor.https.mode to false. That way the Status page can be accessed via plain HTTP.
Accessing the Status page requires basic authentication and is available only to users that have the "System-Status" role.
If the Remote Manager is running behind a Load Balancer which offloads the SSL, then the mprm.monitor.https.mode property needs to have value false.
Status Page Information
The first section of the Status page contains the main auto diagnostic mechanism. The status field may have three types of values:
- Healthy
- Error
- Warning
The Alert Board section is populated with all errors that occur, if any:
Status: ERROR Server Start Time: 2018-05-30-14:57:24 Alerts: Wed May 30 15:10:52 EEST 2018 MIDDLE M2M Group Admin service is not available! Wed May 30 15:10:52 EEST 2018 CRITICAL GroupBeAdmin service is not available. Rule Engine will be disabled. Wed May 30 15:10:52 EEST 2018 CRITICAL OperationManagerMS service is not available. Rule Engine will be disabled. Wed May 30 15:10:52 EEST 2018 CRITICAL RuleEngineBE service is not available. Rule Engine will be disabled. Wed May 30 15:10:52 EEST 2018 MIDDLE OperationManagerMS is not available. MS GDM System can not init control unit providers.The next section contains all installed packages with their exact versions:
Installed Packages: 15 System:7.0.0-SNAPSHOT Development Tools:5.0.0-SNAPSHOT Foundation:7.0.0-SNAPSHOT Web Service API:7.0.0-SNAPSHOT Generic Device Management:7.0.0-SNAPSHOT Software Repository:7.0.0-SNAPSHOT Generic OSGi Device Management:7.0.0-SNAPSHOT OSGi Device Management:7.0.0-SNAPSHOTThe last section of the page contains valuable performance metrics. Configuring which exact metrics to be displayed is done via their specific properties.
JVM - Heap - Allocated (MB): 271JVM - Heap - Max (MB): 455JVM - Heap - Used (MB): 155JVM - Total Memory - Allocated (MB): 378JVM - Total Memory - Max (MB): 455JVM - Total Memory - Used (MB): 245OSGi Devices - Connection Opening Rate (requests/sec) [1m/5m/15m EMA]: [0.00 / 0.00 / 0.00]OSGi Devices - Open Connections (to this server instance): 0OSGi Devices - Pending Connection Logins: 0System - Physical Memory - Free (MB): 2139System - Physical Memory - Total (MB): 7869Process - CPU Load (%): 0System - CPU Load (%): 10Keep in mind that only the last 10 metrics are kept in the default directory(<rm_main_directory>runtime\bin\mserver\mprm_report.metrics) as they are rotated on a 24-hour basis.
System Properties
The following system properties are used to configure the RM State Monitor:
Property | Default Value | Description |
|---|---|---|
|
| Configures the RM status check period in seconds. |
|
| Configures whether to skip logging the already logged alerts for a predefined period of time. It is reasonable to activate this option to avoid flooding RM Log with one and the same error/warning and save its readability when the RM is in error/warning state for a long time |
|
| Configures the period in seconds to skip the already logged alerts logging. It is taken into account only when the mprm.monitor.skip.logged.alerts property is set to true. |
|
| Configures if the RM Status can be obtained only via HTTPS scheme. |
|
| Configures the RM start time format. |
Creating System Status Configurations
If the default relation between the raised alerts and the overall RM Status is not suitable for a particular usecase, custom system status configurations can be created to fit specific scenarios. That way the RM Status will be changed only if all addressed filters match. Any RM Status update can be configured by Bundle Location, Bundle Name, Device/Management Server ID or Message. Regular expressions are supported and any additional information can be added in the Comment field.
In the example configuration below all alerts coming from tr069 bundles will be ignored.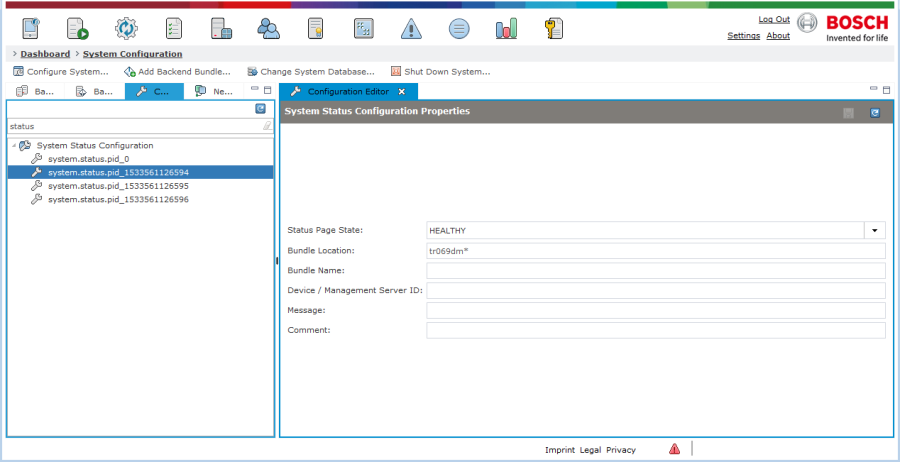
As we can see below, the Remote Manager is still in Healthy state despite the critical alerts that occur.
Status: HEALTHYServer Start Time: 2018-08-06-16:12:17Alerts: Tue Aug 07 13:55:07 EEST 2018 LOW The CPEBehindNATSupport is not active so the connect trigger for CPE behind NAT will not be supported! Tue Aug 07 13:55:08 EEST 2018 CRITICAL TR-069 Database is unavailable! TR-106 support will be limited! Tue Aug 07 13:55:08 EEST 2018 LOW The Database is not active so the connect trigger for CPE behind NAT will not be supported! Tue Aug 07 13:55:08 EEST 2018 CRITICAL The Synchronizer is not active and the Device-Gateway Association won't function normally! Tue Aug 07 13:55:08 EEST 2018 CRITICAL The Database is not active and the Device-Gateway Association won't function normally! Tue Aug 07 13:55:07 EEST 2018 CRITICAL The ConfigurationProvider is not active so the TR069 ACS session will use the default configuraton!How to Configure Metrics?
Metrics could be configured with the usage of system properties. The easiest way is to add or alter the needed system properties.
- Console reporter (default period is 2 min):
mprm.metrics.console.report.period.sec = (in seconds)mprm.metrics.console.report = [true | false]- CSV files reporter (default period is 2 min):
mprm.metrics.csv.report.period.sec = (in seconds)mprm.metrics.csv.report.dir = (default is "mprm_reports.metrics")mprm.metrics.csv.report = [true | false]- JMX reports:
mprm.metrics.jmx.report = [true | false]For testing purposes you can use VisualVM with the MBeans plugin installed.
Example configuration:
Activating the CSV reporter is done by uncommenting the following properties:
mprm.metrics.csv.report=truemprm.metrics.csv.report.period.sec=60