Visualize the geolocation of the demo device
The Bosch IoT Insights' dashboard allows - among others - to explore your data forwarded by the digital twin layer and to visualize the values in a chart.
This example will show how to visualize the geolocation values on a map. However, there are a lot more options, once you are familiar with the concepts.
For more information on how to use Bosch IoT Insights, refer to the Bosch IoT Insights' documentation.
Prerequisites
At this point, we assume you have already
configured the connection to forward data from the digital twin layer to Bosch IoT Insights (see Create a managed connection to Bosch IoT Insights)
granted read access on path thing:/features i.e. the demo device policy allows the forwarding on path geolocation (see Expand the policy of the demo device)
Create a new query template
If your subscription is completely new you will need at least one query template. In this example we create one dedicated to the geolocation feature.
Navigate Explore > Data Explorer > Add Query Template

Don't forget to invite project members with the respective roles through the Access rights area - that will make the query template and the corresponding widget visible on the dashboard for them as well.
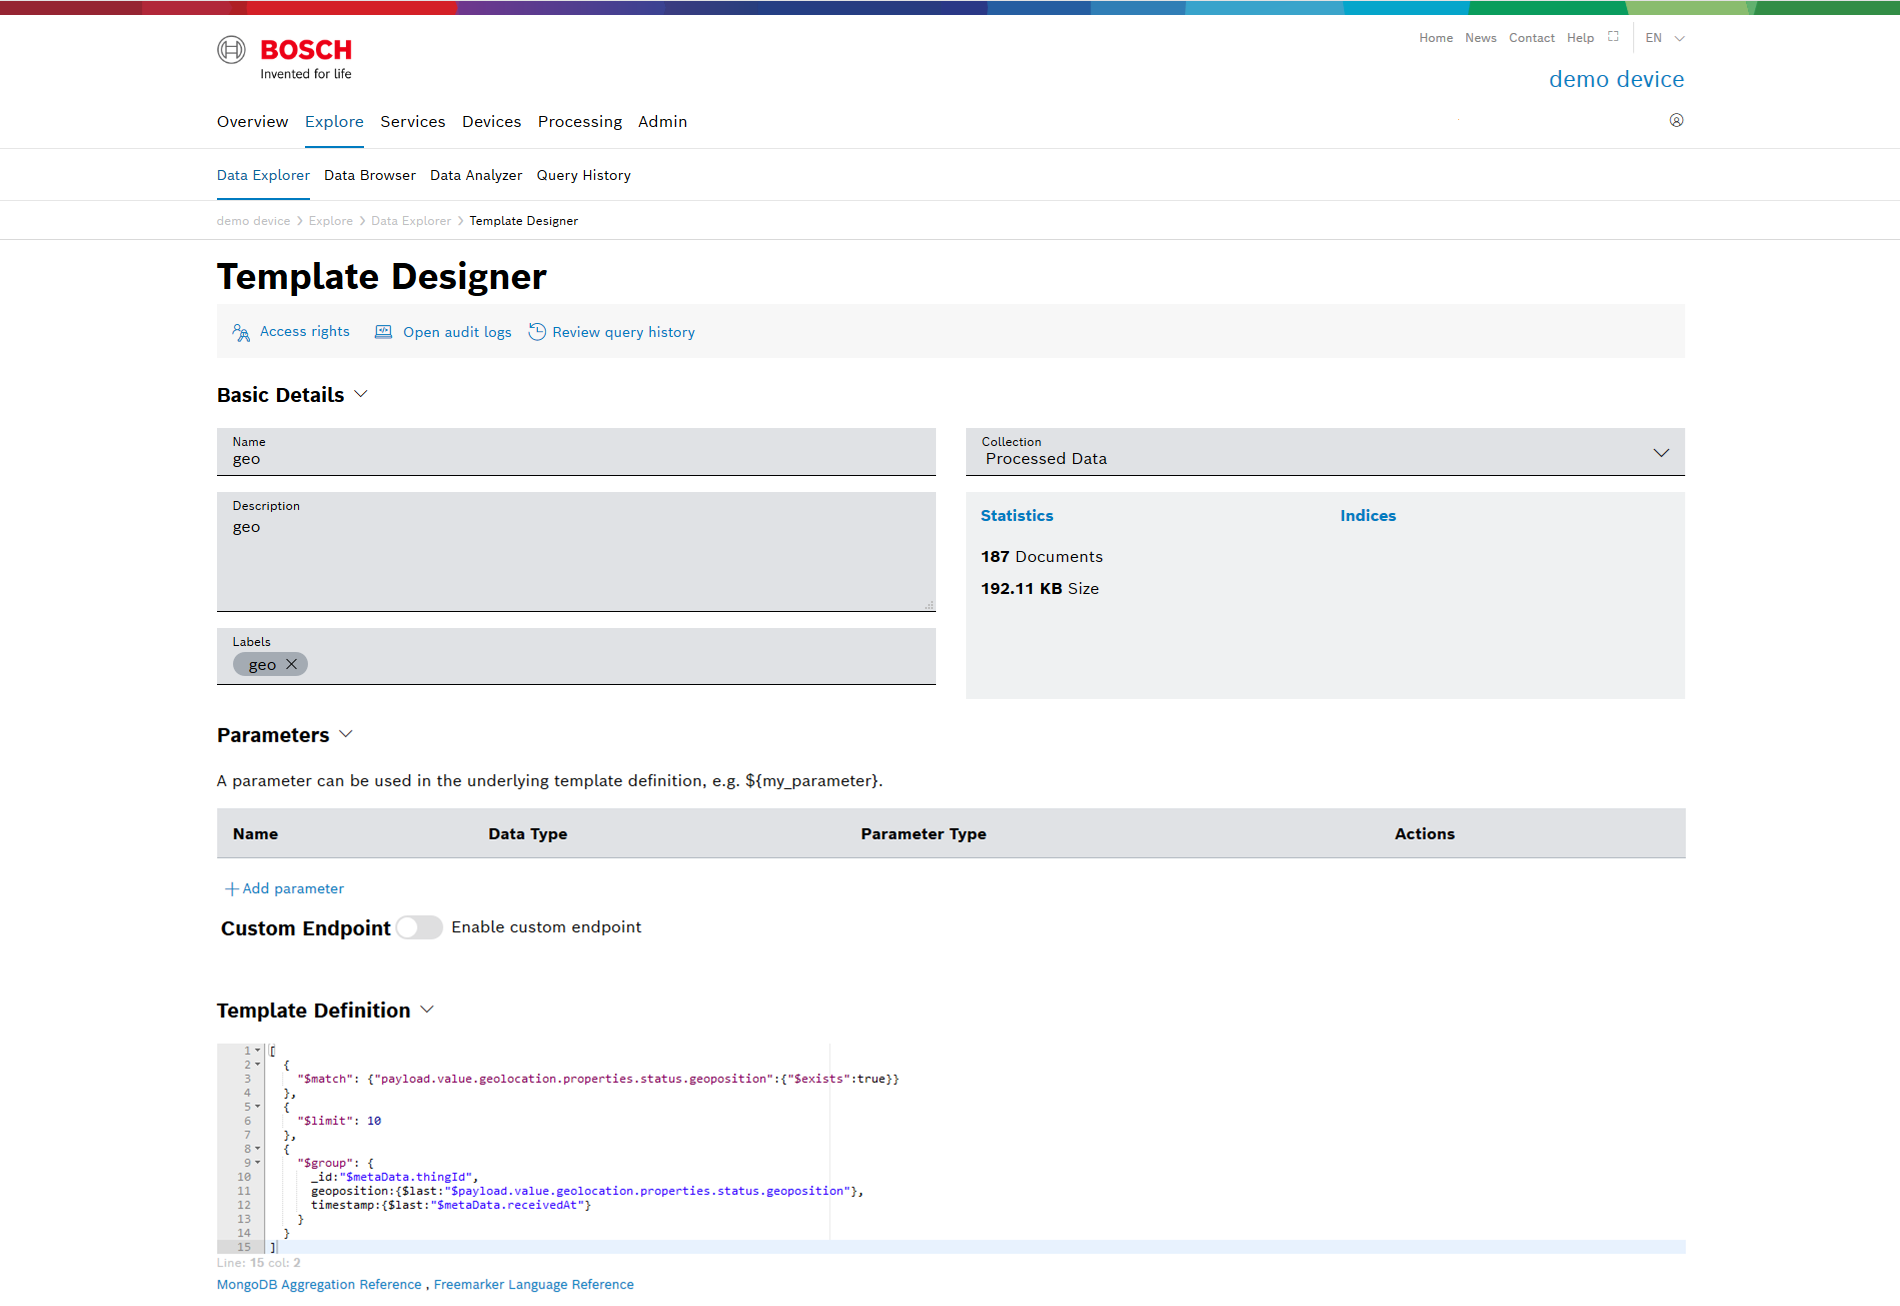
The new query template created for this example, looks like in the following snippet.
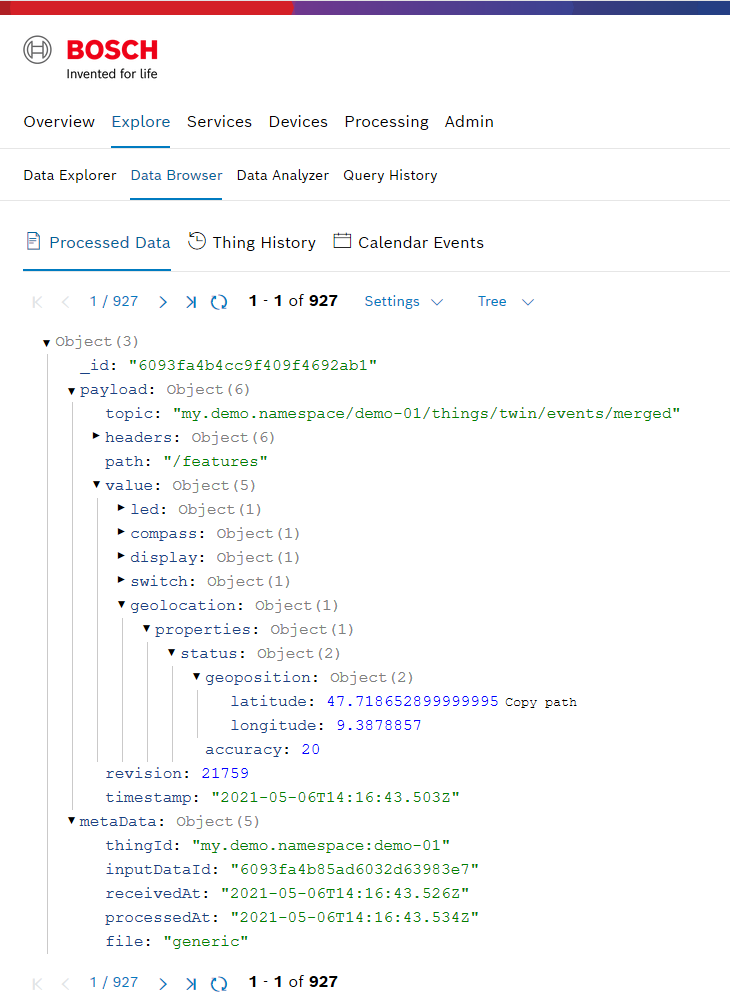
[ { "$match": {"payload.value.geolocation.properties.status.geoposition":{"$exists":true}} }, { "$limit": 10 }, { "$group": { _id:"$metaData.thingId", geoposition:{$last:"$payload.value.geolocation.properties.status.geoposition"}, timestamp:{$last:"$metaData.receivedAt"} } }]You don't need to type all the paths. They can be copied from the Data Browser view
Add a widget to display the values

Scroll down to the very end of your Overview page.
Click Add widget.
From the General view, select the one that you think is closest to your needs.
In this example, we show the steps for a Location Map.The Location Widget view highlights the missing default settings.
As a Data Source, you can select:
Query Template
Your own query template created in the section above.
Save data source
For the Trace: Location Map, select the data fields of your thing, i.e. the path where the values of the demo device sensor are addressed.
Latitude select [i].geoposition.latitude
Longitude select [i].geoposition.longitude
Id - set the ID of your demo device [i]._id
Click Save to have this widget rendered on your "Overview" page.
Further hints
By default, the widget shows up at the end of the page.
If you need the size or the title adjusted:
Click Activate Editing at the end of your Overview page
Then click the edit icon in the upper right corner of the chart.
E.g. to adjust the width edit Dashboard settings > Size > Half (2 Columns).Click Save to close the editing mode.
If you want to see the chart at the start of the page:
Click Start sorting at the end of your Overview page.
Drag and drop the widget to the top.
Finish sorting.
Please remember, that filtering the amount of data at the step "Explore > Data Analyzer" will be crucial when working with more than "lab data" of one device.
https://bosch-iot-insights.com/static-contents/docu/html/Data-Explorer.html