Monitor devices
To follow these steps, open Devices from the left navigation.
You can monitor every single device in the context of mass management executions.
For that you have several different entry points, and we will explore them below.
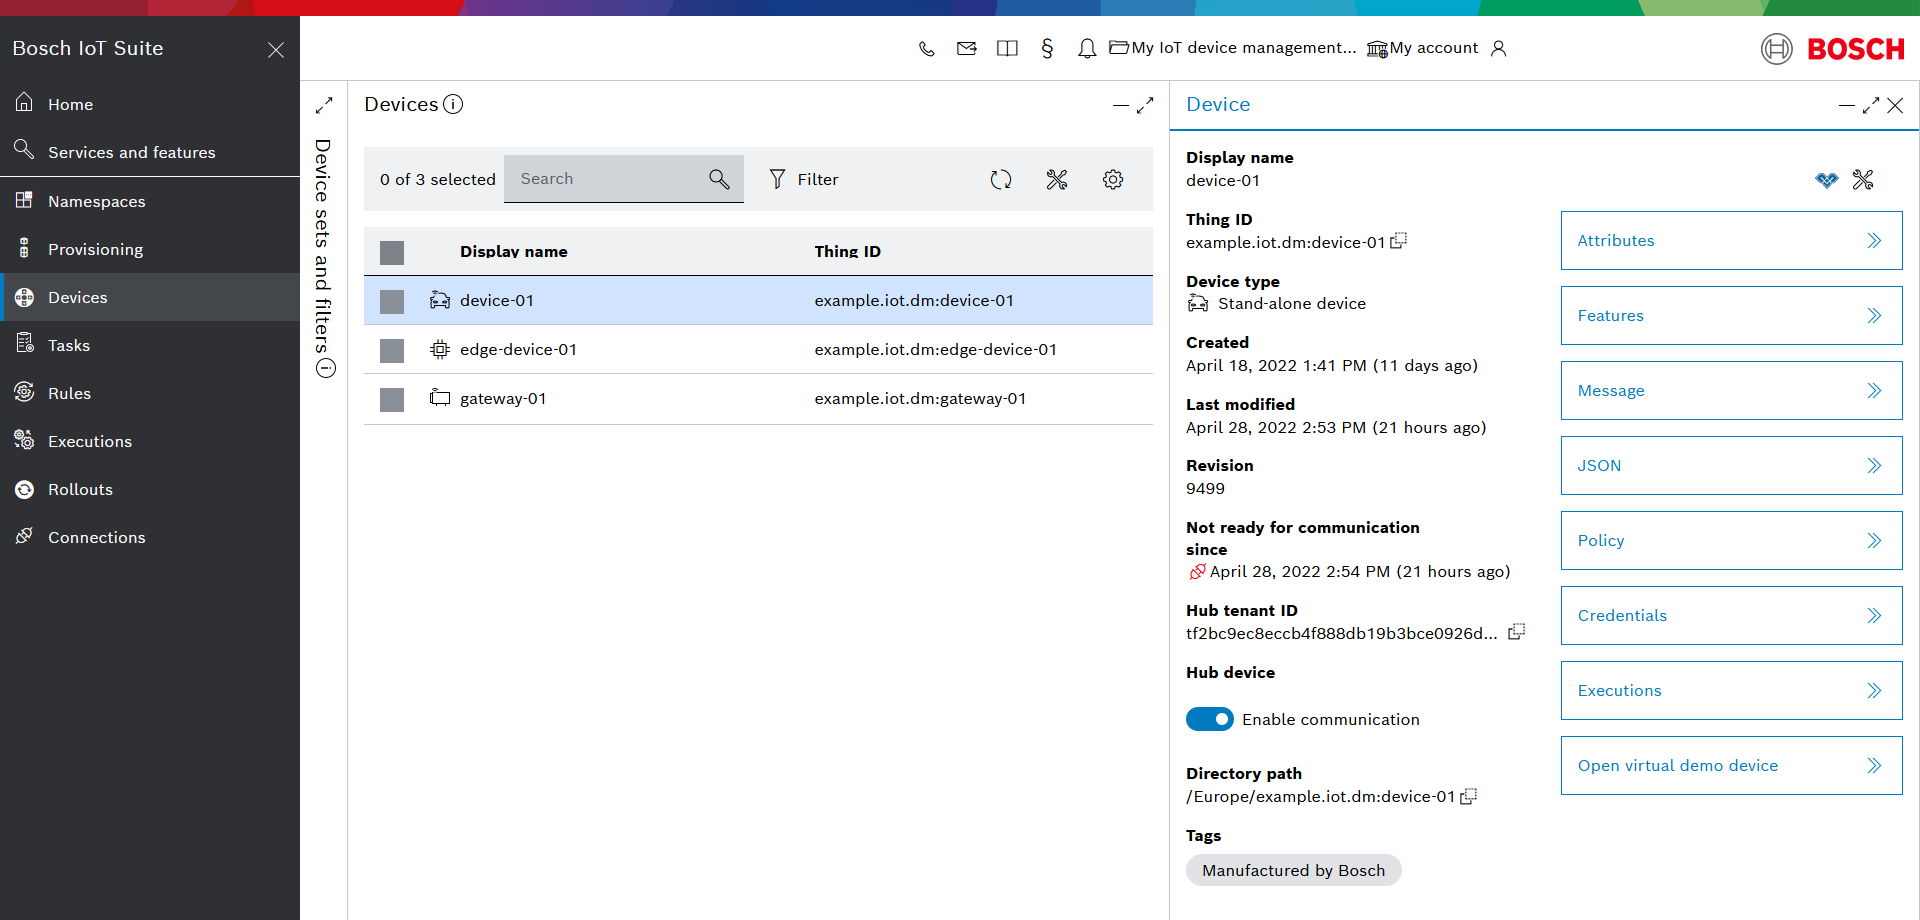
Starting from Devices on the left navigation, select a device on the list of devices and then select the Executions blade in the device details area to the right.
Upon that you will be redirected to Executions, where the displayed list of executions will be filtered for the particular device only.
It will show you all mass management tasks and rules in which the device has been involved so far.

To see more details about the device execution state within the task or rule of interest, expand the respective item on the list.
Select an item from its tree for even more fine-grained monitoring information - partial execution details.

Alternatively, you can start your device monitoring journey from the perspective of a particular task or rule.
For that purpose, go to Tasks or Rules in the left navigation.
Select a task or a rule from the list.
In the task/rule details area:
check the Scope>Selected devices to see if your device has been involved in this task/rule.
check Last execution on devices > All involved or any of the execution status subsets (Running, Finished with success, etc.)
This will bring you to Executions, where the displayed list of executions will be filtered for the selected task/rule only, and/or for the respective subset of devices.
